Release
New Copilot usage metrics impact dashboard
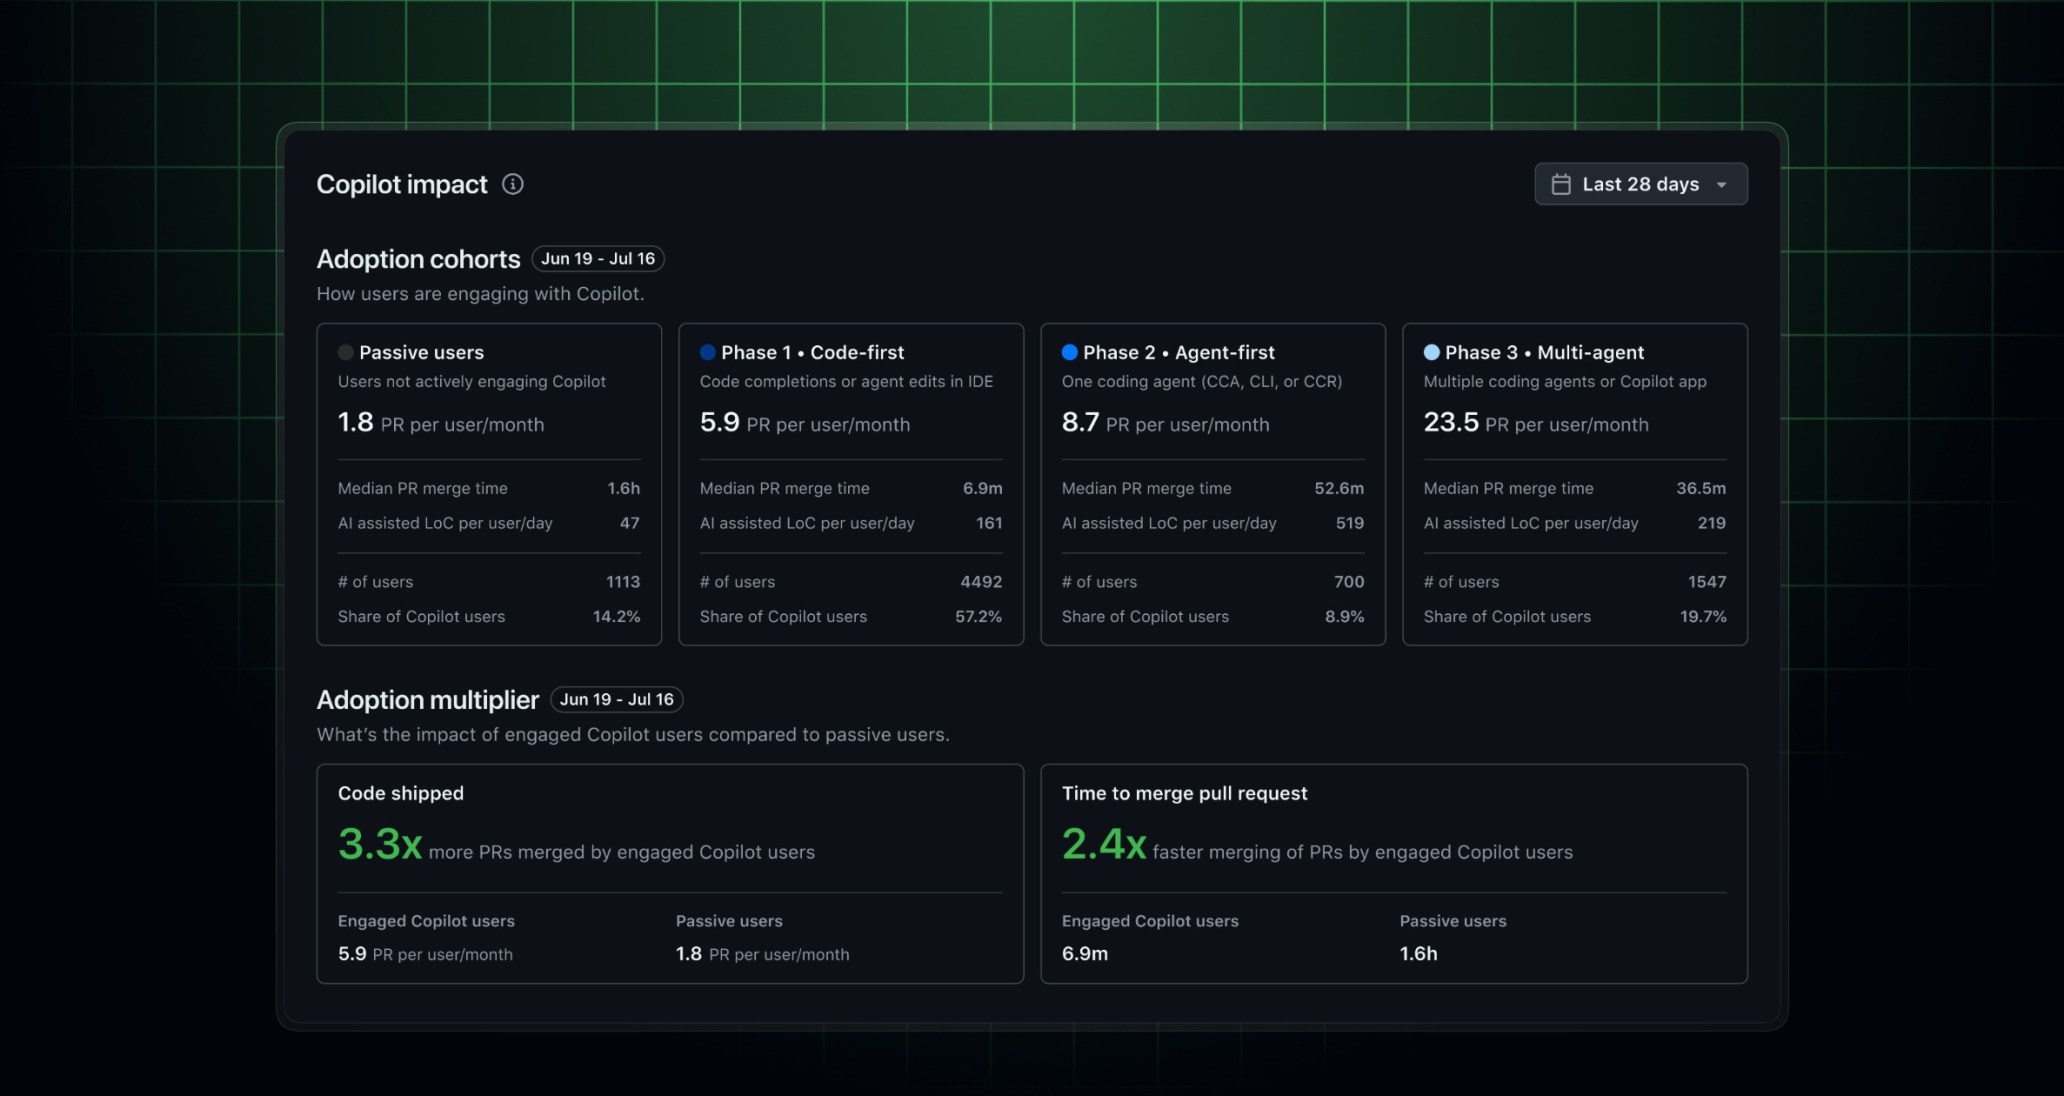
We’ve released a new Copilot metrics impact dashboard for enterprise administrators and organization owners. This dashboard helps you tell a deeper Copilot impact story by sharing not just who is active, but how they’re using Copilot. The dashboard builds on the AI adoption phase cohorts in the Copilot usage metrics API, turning the per-phase data into a visual view of adoption depth, impact, and the next steps that move developers into deeper-adoption cohorts.
What’s new
The dashboard groups your engaged users by AI adoption phase and surfaces the metrics that matter for each cohort:
- Adoption cohorts: Per-cohort cards for Phase 1 (Code-first), Phase 2 (Agent-first), and Phase 3 (Multi-agent or Copilot app), plus a Passive (licensed but not engaged) segment. Each card shows average pull requests merged per user per month, median pull request merge velocity, users in the phase, share of overall users per phase, and average lines of code per day per user.
- Adoption multiplier: A comparative bottom-line-up-front throughput and speed comparison between your passive cohort and the average of your engaged Copilot users.
- Trends: Charts that show cohort growth and pull request throughput over six months.
- Recommended next steps: Guidance an admin can act on to move more users into deeper-adoption cohorts.
Why this matters
- Tell the maturity story: Move beyond simple active-user counts and see which Copilot capabilities your developers are actually adopting.
- Target enablement: Spot licensed-but-not-engaged users and get clear, actionable next steps to deepen adoption.
Important notes
- The dashboard is available to enterprise administrators and organization owners who have access to Copilot usage metrics.
- Cohort assignments use the same
ai_adoption_phaseclassification as the Copilot usage metrics API, based on Copilot product usage over a rolling 28-day window.
Join the discussion within GitHub Community.