Manage your application security stack effectively with the tool status page
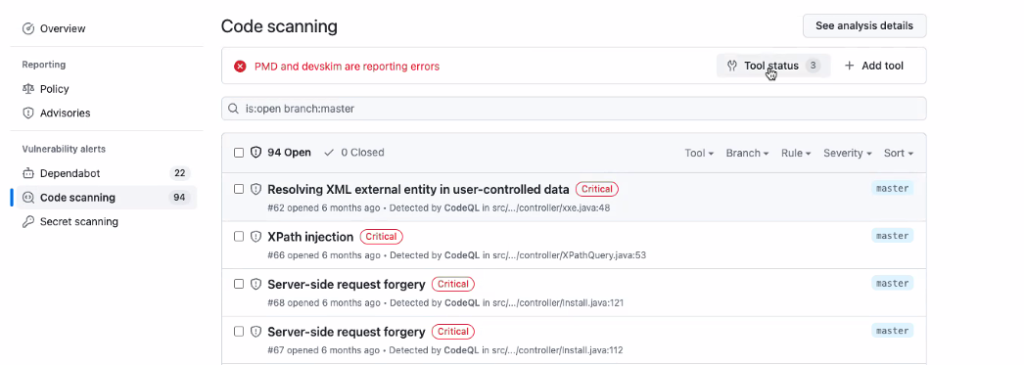
Code scanning’s tool status gives you a bird’s eye view of your application security stack, allowing you to quickly confirm everything is working, or troubleshoot any tool in your application security arsenal.

As a developer, there’s a variety of application security tools that you can use to help secure your applications. It’s not uncommon to find yourself balancing multiple tools in your application security stack, whether they be an open source or third-party solution. Code scanning specifically gives you the ability to integrate a variety of code analysis tools, beyond just our native CodeQL engine, directly into your workflow on GitHub.
To make it easier to manage these solutions, we’ve launched a tool status page for GitHub code scanning. The tool status page shows detailed information about the security tools that upload results to code scanning, whether that be a single engine like CodeQL or a complex stack of multiple tools. This allows you to quickly confirm that your code analysis tools are working properly, or if they’re not, helps you easily identify what needs your attention.
How does the tool status page work?
You can access this feature by clicking the new “tool status” button at the top of the code scanning page. A tool status will be displayed if you have run at least one analysis with that tool on the default branch of your repository. Every tool has three possible statuses: not working, needs attention, or working. Note that you’ll still see the results of the scan, even if there is a tool status alert.
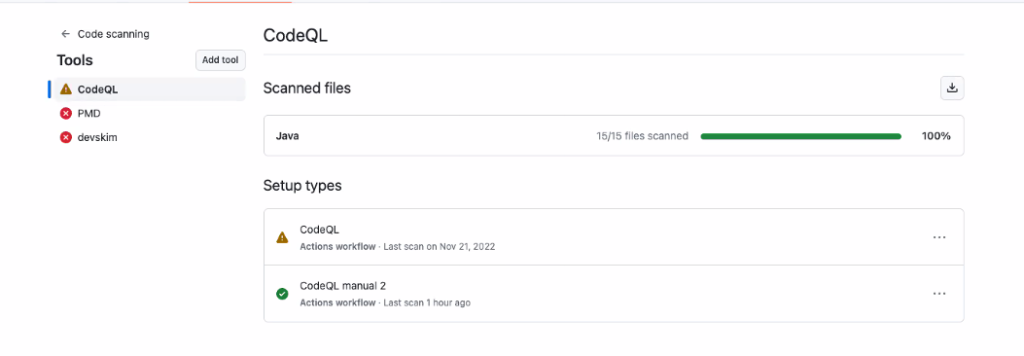
When we click on the tool status button, you’ll see a view of the tools you have running under the “Tools” sidebar. Here you can see an example of the statuses “needs attention” represented by the yellow icon and “not working” represented by the red icon in the side bar.
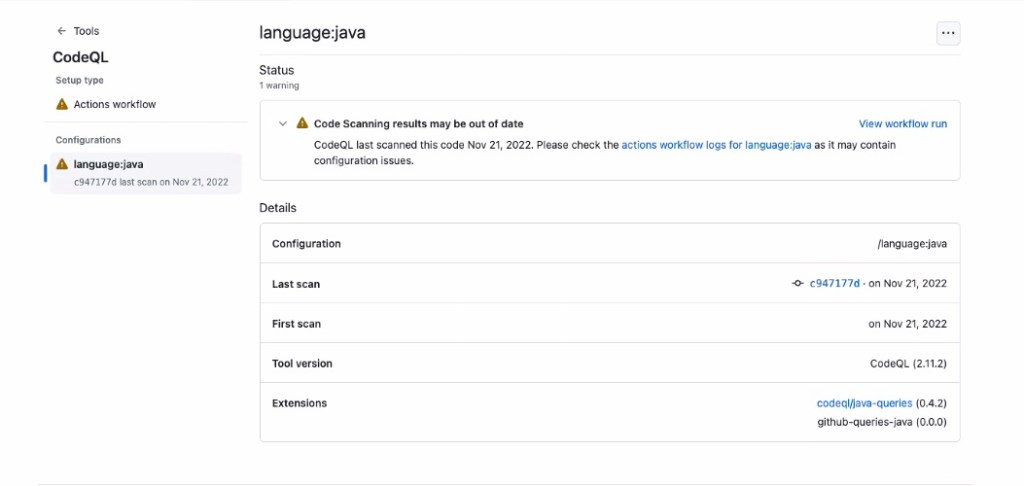
If we click into CodeQL we can see an error in our configuration. By clicking on the error we can understand what is wrong with the configuration and quickly and efficiently fix the problem.
This should make troubleshooting your configuration for CodeQL and other tools a breeze. If you’re interested in learning more about application security orchestration using code scanning, check out our recent blog.
Learn more about GitHub security solutions
GitHub is committed to helping build safer and more secure software without compromising on the developer experience. To learn more or enable GitHub’s security features in repositories, check out the getting started guide.
Tags:


Related posts
Stacked sessions and pull requests in the GitHub Copilot app
Learn how I modernized an old codebase of mine using stacked sessions and pull requests in the GitHub Copilot app.

The cost of saying yes has changed
The cost of writing code dropped; the cost of owning it didn’t. A framework for deciding which changes are actually cheap in the AI era.

GitHub for Beginners: Your roadmap to mastering the GitHub essentials
New to GitHub? This beginner’s guide explains version control, repositories, and pull requests—plus everything else you need to start working confidently on GitHub.