Include diagrams in your Markdown files with Mermaid
A picture tells a thousand words. Now you can quickly create and edit diagrams in markdown using words with Mermaid support in your Markdown files.

A picture tells a thousand words, but up until now the only way to include pictures and diagrams in your Markdown files on GitHub has been to embed an image. We added support for embedding SVGs recently, but sometimes you want to keep your diagrams up to date with your docs and create something as easily as doing ASCII art, but a lot prettier.
Enter Mermaid 🧜♀️🧜♂️
Mermaid is a JavaScript based diagramming and charting tool that takes Markdown-inspired text definitions and creates diagrams dynamically in the browser. Maintained by Knut Sveidqvist, it supports a bunch of different common diagram types for software projects, including flowcharts, UML, Git graphs, user journey diagrams, and even the dreaded Gantt chart.
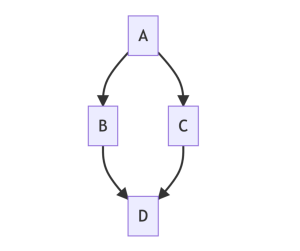
Working with Knut and also the wider community at CommonMark, we’ve rolled out a change that will allow you to create graphs inline using Mermaid syntax, for example:
```mermaid
  graph TD;
      A-->B;
      A-->C;
      B-->D;
      C-->D;
```
The raw code block above will appear as this diagram in the rendered Markdown:
How it works
When we encounter code blocks marked as mermaid, we generate an iframe that takes the raw Mermaid syntax and passes it to Mermaid.js, turning that code into a diagram in your local browser.
We achieve this through a two-stage process—GitHub’s HTML pipeline and Viewscreen, our internal file rendering service.
First, we add a filter to the HTML pipeline that looks for raw pre tags with the mermaid language designation and substitutes it with a template that works progressively, such that clients requesting content with embedded Mermaid in a non-JavaScript environment (such as an API request) will see the original Markdown code.
Next, assuming the content is viewed in a JavaScript-enabled environment, we inject an iframe into the page, pointing the src attribute to the Viewscreen service. This has several advantages:
- It offloads the library to an external service, keeping the JavaScript payload we need to serve from Rails smaller.
- Rendering the charts asynchronously helps eliminate the overhead of potentially rendering several charts before sending the compiled ERB view to the client.
- User-supplied content is locked away in an iframe, where it has less potential to cause mischief on the GitHub page that the chart is loaded into.
The net result is fast, easily editable, and vector-based diagrams right in your documentation where you need them.
Mermaid has been getting increasingly popular with developers and has a rich community of contributors led by the maintainer Knut Sveidqvist. We are very grateful for Knut’s support in bringing this feature to everyone on GitHub. If you’d like to learn more about the Mermaid syntax, head over to the Mermaid website or check out Knut’s first official Mermaid book.
Tags:


Related posts
Transitioning as a Hubber
How GitHub’s culture and benefits helped me be the best version of myself.

I automated my job (and it made me a better leader)
Explore how my day as a senior leader looks now that I use 40 automations to help, and learn more about some of my favorites.

GitHub for Beginners: Answers to some common questions
Find the answers to some of the most common GitHub-related questions.