Octoverse Spotlight 2021: The Good Day Project—Personal analytics to make your work days better
Table of contents Executive summary Key findings Key takeaways for developers and software teams About the study What we found Interruptions and meetings have a large influence on our days…

Table of contents
Executive summary
What we found
- Interruptions and meetings have a large influence on our days
- Take a minute to reflect
- SPACE reveals patterns and describes developers’ days holistically
- Showing patterns to developers helps them see what’s a Good Day for them
- But what about me? Can the Good Day Project help make more of my days awesome?
The wrap: 10/10 would recommend
Acknowledgements
Appendix: Good Day survey
Executive summary
So much of our time and energy goes into our work days, and the past year has shown us the importance of balancing work and life when the lines between them blur. Developers want to make their work days better — and to make them better consistently and reliably. It feels great to get into a flow and have an awesome day or an awesome week, but can be frustrating to fall out of that flow and find ourselves looking back on our days wondering: what was it that made things “click” into place? Without some kind of consistent signal it’s hard to know what patterns make good days, and it can be a lot of effort to put the data and patterns together ourselves.
These questions prompted the Good Day Project, an internal to GitHub investigation into what helps developers have good days. Our study reinforces that productivity is personal, and shares tips that can be used by developers today — even without an automated solution or a tool like the one we’re experimenting with. This spotlight centers on three main findings: the impact of interruptions, the value of daily reflections, and the SPACE productivity framework. We include a discussion of seeing patterns in our work and what this means for you, as well as next steps for the project.
Key findings
- Interruptions are more disruptive than we think — and it affects more than just our work. With minimal or no interruptions, developers had an 82% chance of having a good day, but when developers were interrupted the majority of the day, their chances of having a good day dropped to just 7%. By minimizing distractions and creating focus time, we not only get work done, we create better and less stressful days for ourselves.
- Meetings can help us connect, but too many can get in the way of our progress. In our study, going from two to three meetings per day lowered the chances of developers making progress toward their goals from 74% to just 14%. And developers who average just one meeting per day have a 99% chance of knocking out high quality work — it really is about getting focus time and connecting with our colleagues to brainstorm ideas.
- There’s more to development work than writing code. Developers who pushed more code and created more pull requests had a greater chance of feeling like they had a good day, but that didn’t tell the whole story. Developers who created the most pull requests didn’t have the best days — this could be because creating pull requests took them out of their flow and interrupted their days.
Key takeaways for developers and software teams
- Take a minute to reflect. Feedback from developers showed that the simple act of taking a few minutes at the end of each work day to reflect made a big difference in how they felt. Noting key activities and how they felt about the day helped developers “close out” their day and gain insight. In other words, this small moment has a big impact for those of us wanting to pause and reflect on our days and work. And it can be done by anyone, and doesn’t require any fancy tech or tooling — a simple notebook or markdown file can work.
- Manage your interruptions. Developers’ good days were days when they achieved flow. Days with fewer interruptions and meetings are days of progress, quality work, and less stress. While we can’t always control and line up activities to maximize flow, even small steps to create focus time can add up to a large impact. Try blocking focus time on your calendar and make it visible to others, set yourself to “away”, batch or move meetings, or even see what meetings you can treat as optional.
- Think about productivity holistically. We saw that developers’ good days — and ultimately their productivity — go way beyond activity counts. Using a more elaborate model that included more collaboration, less interruptions, and other work realities we were able to explain and predict progress, quality work, “getting things done”, and “feeling good”. These are outcomes that developers and teams care about and using appropriate indicators can help everyone be intentional and strategic about managing their energy and resources.
About the studyWe want to help make developer days awesome, so we launched the Good Day project as an internal GitHub investigation. As we discussed the project, the following questions inspired our research direction:
The Good Day project was designed based on peer-reviewed research and a developer-first perspective:
We recruited 40 individual contributor engineers to participate in our study at GitHub; all participants worked remotely and they spanned several levels, geographic locations, teams and products. For two weeks, folks were prompted either once or twice a day to complete quick surveys that took less than two minutes. The survey asked the developers to first characterize their day — was it Awesome, Good, OK, Bad, or Terrible? — and then quickly describe their day using survey questions based on the SPACE productivity framework. Each developer’s survey data was then mapped to their GitHub activity data for that day: their pushes, pull requests, comments, and issues. Connecting each developer’s daily survey data to their daily activity data helped us — and each developer — look for patterns in what makes good days. At the end of two weeks we gave each developer their own report with charts about their activity, well-being, flow, collaboration etc, highlighting their good days to make it easy to see patterns. Consistent with our study principles, a developer’s personalized report was only shared with them directly* and never shared with anyone else. * The research team had access to the individual reports for testing, validation and measurement purposes. This was disclosed to the participants and the reports were never shared beyond the research team. Here we report only aggregate, anonymous data. |
What we found
With the Good Day project we wanted to support developers in understanding their days. Developers’ work habits are malleable, but they could use more specific insights into how to improve them. So we tried a combination of collecting rich information about a work day, encouraging daily reflection, and presenting thoughtful patterns — through charts and commentary — to developers to prompt action. Here is what we found!
Interruptions and meetings have a large influence on our days
The efficiency or flow of a given day — in other words, interruptions and meetings — has an outstanding impact on whether that day is a good one.
On days that were free of interruptions or had just a few of them, developers’ chances of having a good day were 82%. And when developers reported being interrupted for the majority of the day the chance of a good day dropped to 7%. And that’s not all. Interruptions bring an additional cost: stress. When experiencing interruptions most of the day, developers had a 77% chance of feeling stressed. Even a moderate amount of interruptions (for some of the day) increased the chance of stress from 1.6% to 36.4%!
Meetings were similarly a stumbling block. With an average of two meetings a day the chance of developers feeling like they made progress towards their goals was 74%. But stepping over that threshold to averaging three meetings per day meant a 14% chance of making progress — that’s a substantial drop! And when meetings were pushed down to an average of one a day? Developers had a 99% chance of doing quality work.
Not all meetings and interruptions are in our control to schedule, move, or avoid. And not all interruptions are bad — sometimes they give us time to rest and think. But too much interruption too frequently can make it hard to get our work done. Blocking times on your calendar and making yourself selectively (un)available were strategies the developers in our study tried in their own practice, and that they found helpful to minimize fragmentation and help reduce disruption.
Looking at what brings disruption to your day gives a deeper understanding and offers more ideas for taking action than simply looking at a contribution graph. How do meetings and interruptions affect your days? What techniques have you tried to limit or contain disruption?
Activity alone is not adequate for characterizing developers’ days. More information is needed, especially about focus and flow.There is more to a developer’s day than their coding activity and relying solely on activity counts to express a day’s productivity can produce a weak or misleading signal. Once we chose to use the SPACE framework and gathered developers’ self reports, we pieced together a much richer view of developers’ days. Activity — including pushes, commits, pull requests, and issues — explained just a small part of developers having a good day, or feeling like they made progress or did quality work. Also, those with the most pull requests did not report the best days. |
Take a minute to reflect
When we launched the Good Day project we worried that developers would find the format — daily prompts to answer questions — tedious or disruptive, and that they would stop engaging. We found just the opposite! In addition to an impressively high response rate — 90% completion during the two weeks of daily surveys — developers, after the fact, told us they would have continued the study for twice as long.
Why would developers be willing to complete reports for four weeks? Turns out, the insights from the personal reports weren’t the only useful part of the experience. One of the core benefits developers got out of the Good Day project was developing the habit of self-reflection. It made them more mindful about their day as it was unfolding:
“It forced me to think about how my day is developing instead of just letting it develop and reacting to whatever happens.”
Daily reflection is powerful: it makes us aware of areas for improvement, and can increase our satisfaction. The Good Day project capitalized on daily reflection to provide immediate value to developers. The majority of developers who participated in the Good Day project were excited to complete the daily reflection, and some even continued the daily self-reflection long after our two-week study was over!
|
Developers’ days can be classified two ways: Flowing and Disrupted
Using the SPACE productivity framework, we were able to classify the types of days a developer typically has. The data shows developer days can often be classified into one of two ways: Flowing and Disrupted Days. The classifications were based on questions we asked developers about their day, and included things like stress, breaks, meetings, interruptions, if they worked with or helped others, and how much work they got done. Using cluster analysis, we found that typical developer days often fall into two categories:
* The shaded cells are the most predictive items. What distinguished Flowing days from Disrupted days was an average of less than three meetings a day and interruptions being contained to a small part of the day. Flowing days were also more likely to be rated as good days, so managing to safeguard our focus can help us have better days. Being able to make progress toward goals much of the day also impacted how developers felt about their days. Tip: This research showed that developers feel good about their days by making just some progress toward their goals. Let’s remember this — having a good day is achievable and doesn’t require heroic efforts. Small steps to create focus time can add up to a large impact on our days. |
SPACE reveals patterns and describes developers’ days holistically
Using the SPACE framework to create survey questions and measure developer days worked well. Both the questions and the response options we gave developers resonated with them and how they think about their days. The responses were normally distributed and included a full range of responses, suggesting an initial scientific validation. In addition, over 60% of folks said they were excited to complete the surveys every day.
In future work, we would continue using these questions, and may add a few more. The post-study feedback survey gives us a few hints about what directions may be useful. First, our participants said the survey wasn’t too long and wasn’t disruptive, indicating we could add one or a few more questions, which would provide better insights to developers. Second, developers also provided feedback that they were interested in adding a question about how they slept the night before, as well as adding the option for them to provide open-ended comments each day similar to journaling.
Showing patterns to developers helps them see what’s a Good Day for them
The developers in our study were overwhelmingly excited to see their personalized report. The report included several charts with commentary to help developers spot patterns and explore how they might use the information to improve their days. Here we show two examples taken from a sample report with simulated data.
 |
You told us how each day went. On this chart, we marked each day’s response (from 1-Terrible to 5-Awesome) and matched it to your activity on Github.com. Activity isn’t everything! But this gives you a glimpse of what role your dev work plays in you having a good day.
Look at the dark line – |
Figure: Activity/Good days chart with commentary
Each report started with the developer’s split between day ratings: good and not-so-good days. Then, we presented a chart of their activity on github.com and their day ratings across each day they completed a survey. That way a developer could see if and how their volume of activity affects their day ratings — it’s a way to prompt developers to think if activity is the whole story for them. This chart was rated by developers as the easiest to understand.
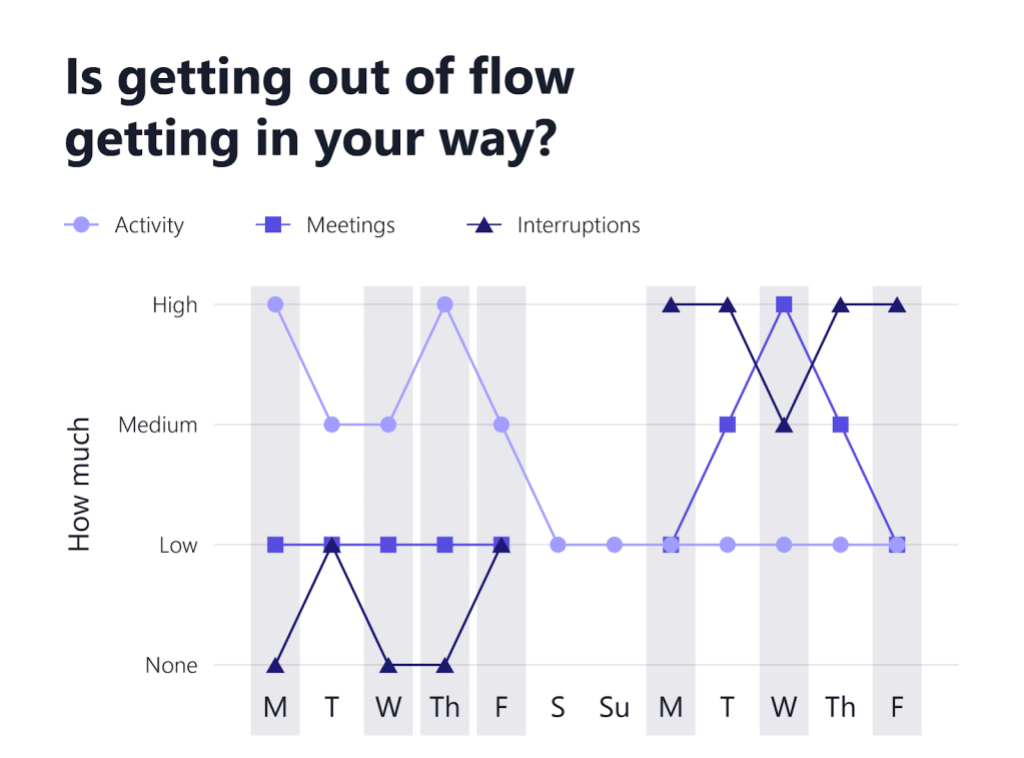 |
Now, here are your interruptions. When our days are fragmented by meetings and interruptions, it can make us less effective. Context switches are cognitively expensive and take time to recover from.
Here’s how interruptions and meetings relate to your dev activity. What do you notice about your Good Days? Not all interruptions and meetings are in our control to schedule, move, or avoid. And not all interruptions are bad — sometimes they give us time to rest and think! But too much interruption, too frequently, can make it hard to get work done. Blocking off times on your schedule and making yourself selectively (un)available can help channel the fragmentation where it will cause the least disruption. |
Figure: Activity/Interruptions/Meetings and Good days overlay chart with commentary
Out of seven charts included in the report, developers found the one above most interesting. It shows a developer’s level of meetings, interruptions, and activity on github.com each day. You’ll also note that the days developers reported as Good Days were highlighted in light grey. This layout helped developers see how meetings and interruptions (measures of efficiency and flow from the SPACE framework) affect both their activity metrics and how well they felt overall that day — so it was a chart that was useful and included several pieces of information. Interest in this chart points to developers wanting to see and understand the effect of flow (or lack thereof) on their days. In our early interviews with developers, many shared that instinctively they believed that fragmented days don’t feel good or they find them less productive; the data from our study confirm their intuitions.
In addition to the smart charts and fun commentary, the Good Day reports were useful and valuable for our participants because they were personalized. This is somewhat unique because many metrics offerings for developers provide data that is aggregated at the team level. Our analysis showed that personalized, actionable insights are important, but they don’t come through in team-level metrics. A few developers in our study had almost opposite patterns — conclusions from the aggregate would be of little help in those cases as the unique patterns would be lost. This highlights that while team aggregations are useful for helping teams improve, only individual-level analysis can help an individual find the patterns to understand and make their days better.
But what about me? Can the Good Day Project help make more of my days awesome?You may be wondering if the findings from this project apply to you. While this early investigation was conducted on a small set of GitHub engineers, there are two strong signals that these findings are likely true for other developers as well: First, our findings align with other research conducted on larger groups of developers. For example, a recent study on daily reflection and gratitude found that the act of reflection improves satisfaction, especially during the difficult circumstances of a crisis. Other studies have demonstrated that self-monitoring brings awareness, and can help developers set goals and improve over time. Interruptions can make a day feel unproductive and slow down progress or finishing up tasks. Finally, the shortcomings of only using activity to proxy developer productivity or work have been identified before: A recent study found that coding time only explained 7% variance in data about developer productivity. Second, we conducted an additional investigation and found that the developers we studied were similar to other non-GitHub engineers: we compared the activity data for those who participated in our study with activity data for developers across paid Teams and Enterprise accounts; we chose this subset of developers because their work environment and activities was most common. The activity patterns seen among our study participants are similar to the most active development teams, defined as those in the top ⅔ of development activity (e.g., pushes and creating pull requests) and among the highest in communication and planning activity (e.g., creating issues, and commenting on pull requests). This is because Hubbers develop and communicate almost exclusively on GitHub.com, meaning their development patterns likely fall into the high range of use; other development teams likely use a suite of tools to develop and communicate about their software, so not all of their activity would be visible on the GitHub platform. |
The wrap: 10/10 would recommend
With the Good Day project we wanted to help developers understand what makes a good day with as little friction and effort as possible. We love doing research — we’re researchers! — but we really love making developers happy. With that in mind, we also checked in to see how our participants felt about the project and how useful the reports were. How did we do?
- The quick prompts at the end of the day were engaging and non-disruptive. We saw a 90% completion rate during the two weeks of the study, and the surveys took developers less than two minutes to complete. Participant feedback corroborated that the frequency of surveys was not disruptive, and that they would continue with the daily surveys for four weeks — twice as long as we asked them to.
- Developers got value in two ways: Actionable insights, and a new healthy habit. Seeing their patterns in personalized reports helped developers discover new ways to optimize their days. For example, some developers said they would schedule more difficult tasks to occur during times of day when they typically have more energy. Many of our participants also reported that the quick reports became a welcome habit of self-reflection. Through the Good Day project, developers got daily prompts to self-reflect as well as a curated set of questions to answer.
- Excitement + No privacy concerns = A delightful experience. In the Good Day project, each developer’s information and patterns were only shared with them. The post-study feedback survey showed that participants did not have data sharing or privacy concerns. The vast majority of developers were excited to do the daily surveys and see their report, and would love to see the Good Day project become an automated solution so they could easily integrate the prompts and self-reflections into their daily routine.
A teaser to remember us by
In the Good Day project we experimented with an approach to bring personal analytics to developers and help improve their days. The developers in our study found it useful and our team also learned a lot — what questions work for daily reflection, how long daily reports can go on for, and what data is informative and supports self-improvement. Next we’re partnering with the Office of the CTO (OCTO) to continue our investigation and iterate on the idea. OCTO created a proof of concept for Hubbers to easily collect their own data, reflect on their work, and find out how to craft their version of Good Days. Check out the demo to see OCTO’s idea for a privacy-respecting, quick interaction using a Slack app and private repositories. We hope that after some dogfooding (or champagne drinking, pick your metaphor!), we can share something valuable and awesome to even more developers. The good news is that you can take steps to improve your days even without a fully automated solution or an elaborate tool —it just takes a quick daily reflection based on a few questions.
Acknowledgements
Many thanks to those who contributed to this project. Each is listed alphabetically (except authors, ordered by contribution). An additional thanks to our anonymous study participants.
- Authors and Researchers: Eirini Kalliamvakou, Nicole Forsgren; equal contribution by Liz Redford and Shonte Stephenson
- Data Scientists: Greg Ceccarelli, Liz Redford, Shonte Stephenson
- OCTO Proof-of-Concept: Irene Alvarado Esteller, Idan Gazit, Matthew Rothenberg, Amelia Wattenberger
- Reviewers: Christian Bird, Denae Ford, Jez Humble, Corey Quinn, Tom Zimmermann
- Copyeditor: Alyss Noland
- Designers: Column 5
Appendix: Good Day survey
| Question | Scale |
|---|---|
| What is your GitHub handle? This is how we will link all your responses and find your system data. | n/a |
| How was your work day? | Terrible Bad OK Good Awesome |
| I worked with other people | None of the day A little of the day Some of the day Much of the day Most or all of the day |
| I helped other people | None of the day A little of the day Some of the day Much of the day Most or all of the day |
| My work was interrupted | None of the day A little of the day Some of the day Much of the day Most or all of the day |
| I made progress toward my goals | None of the day A little of the day Some of the day Much of the day Most or all of the day |
| I did high-quality work | None of the day A little of the day Some of the day Much of the day Most or all of the day |
| I did a lot of work | None of the day A little of the day Some of the day Much of the day Most or all of the day |
| Which best describes how you feel about your work day? | Tense or nervous Stressed or upset Sad or Depressed Bored Calm or Relaxed Serene or Content Happy or Elated Excited or Alert |
| My day was stressful | None of the day A little of the day Some of the day Much of the day Most or all of the day |
| I took breaks today | None of the day A little of the day Some of the day Much of the day Most or all of the day |
| How many meetings did you have today? | 0 1 2 3-4 5 or more |
| Today, I felt most productive: | In the morning (9:00 – 11:00) Mid-day (11:00 – 13:00) In the early afternoon (13:00 – 15:00) In the late afternoon (15:00 – 17:00) Outside typical work hours Equally throughout the day |
| Today, I felt least productive: | In the morning (9:00 – 11:00) Mid-day (11:00 – 13:00) In the early afternoon (13:00 – 15:00) In the late afternoon (15:00 – 17:00) Outside typical work hours Equally throughout the day |
Tags:
Written by

Related posts

GitHub availability report: June 2026
In June, we experienced six incidents that resulted in degraded performance across GitHub services.

Q1 2026 Innovation Graph update: Open source collaboration is accelerating worldwide
New Innovation Graph data shows global developer communities growing faster than ever, with collaboration reaching new highs across many economies.
GitHub joins coalition advocating for fixes to California AI Transparency Act to protect open source
We’re calling for targeted amendments to resolve conflicts with open source licensing and align with international transparency frameworks while preserving regulatory intent.