GitHub Security Lab’s mission is to inspire and enable the community to secure the open source software we all depend on. Learn more about their work.
Security research without ever leaving GitHub: From code scanning to CVE via Codespaces and private vulnerability reporting
This blog post is an in-depth walkthrough on how we perform security research leveraging GitHub features, including code scanning, CodeQL, and Codespaces.

Hello fellow readers! Have you ever wondered how the GitHub Security Lab performs security research? In this post, you’ll learn how we leverage GitHub products and features such as code scanning, CodeQL, Codespaces, and private vulnerability reporting. By the time we conclude, you’ll have mastered the art of swiftly configuring a clean, temporary environment for the discovery, verification, and disclosure of vulnerabilities in open source software (OSS).
As you explore the contents of this post, you’ll notice we cover a wide array of GitHub tooling. If you have any feedback or questions, we encourage you to engage with our community discussions. Rest assured, this post is designed to be accessible to readers regardless of their prior familiarity with the tools we’ve mentioned. So, let’s embark on this journey together!
Finding an interesting target
The concept of an “interesting” target might have different meanings for each one of you based on the objective of your research. In order to find an “interesting” target, and also for this to be fun, you have to write down some filters first—unless you really want to dive into anything! From the language the project is written in, through the surface it unveils (is it an app? a framework?), every aspect is important to have a clear objective.
For example, usually one of these aspects is the amount of people using the project (that is, the ones affected if a vulnerability occurred), which is provided by GitHub’s dependency network (for example, pytorch/pytorch), but it does not end there: we are also interested in how often the project is updated, the amount of stars, recent contributors, etc. Fortunately for us, some very smart people over at the Open Source Security Foundation (OpenSSF) already did some heavy work on this topic.
OpenSSF Criticality Score
The OpenSSF created the Open Source Project Criticality Score, which “defines the influence and importance of a project. It is a number between 0 (least-critical) and 1 (most-critical).” For further information on the specifics of the scoring algorithm, they can be found on the ossf/criticality_score repository or this post. A few months after the launch, Google collected information for the top 100k GitHub repositories and shared it in this spreadsheet.
Within the GitHub Security Lab, we are continuously analyzing OSS projects with the goal of keeping the software ecosystem safe, focusing on high-profile projects we all depend on and rely on. In order to find the former, we base our target lists on the OpenSSF criticality score.
The beginning of the process
We published our Code Review of Frigate in which we exploited a deserialization of user-controlled data using PyYaml’s default Loader. It’s a great project to use as the running example in this blog post, given its >1.6 million downloads of Frigate container at the time of writing and the ease of the setup process.
|
The original issue We won’t be finding new vulnerabilities in this blog post. Instead, we will use the deserialization of user-controlled data issue we reported to illustrate this post. |
Looking at the spreadsheet above, Frigate is listed at ~16k with a 0.45024 score, which is not yet deemed critical (>0.8), but not bad for almost two years ago! If you are curious and want to learn a bit more about calculating criticality scores, go ahead and calculate Frigate’s current score with ossf/criticality_score.
Forking the project
Once we have identified our target, let’s fork the repository either via GitHub’s UI or CLI.
gh repo fork blakeblackshear/frigate --default-branch-only
Once forked, let’s go back to the state in which we performed the audit: (sha=9185753322cc594b99509e9234c60647e70fae6f)
Using GitHub’s API update a reference:
gh api -X PATCH /repos/username/frigate/git/refs/heads/dev -F
sha=9185753322cc594b99509e9234c60647e70fae6f -F force=true
Or using git:
git clone https://github.com/username/frigate
cd frigate
git checkout 9185753322cc594b99509e9234c60647e70fae6f
git push origin HEAD:dev --force
Now we are ready to continue!
Code scanning and CodeQL
Code scanning is GitHub’s solution to find, triage, and prioritize fixes for existing problems in your code.
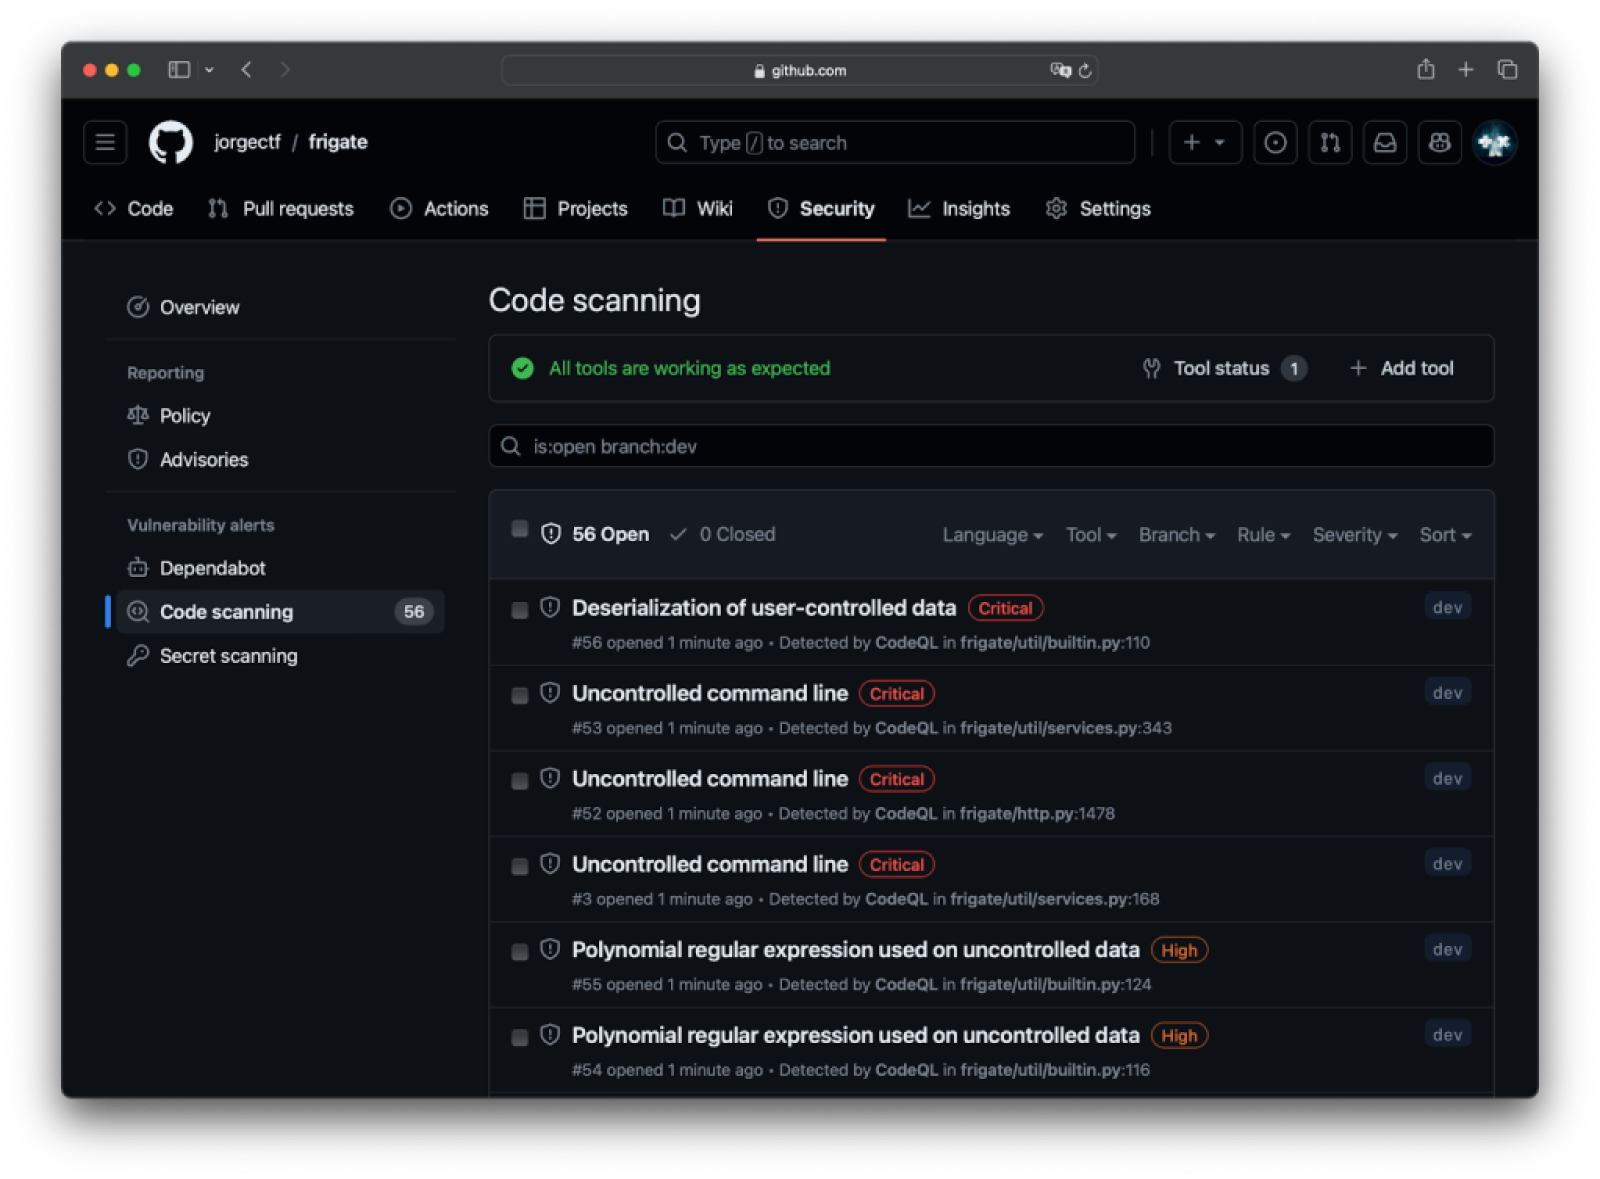
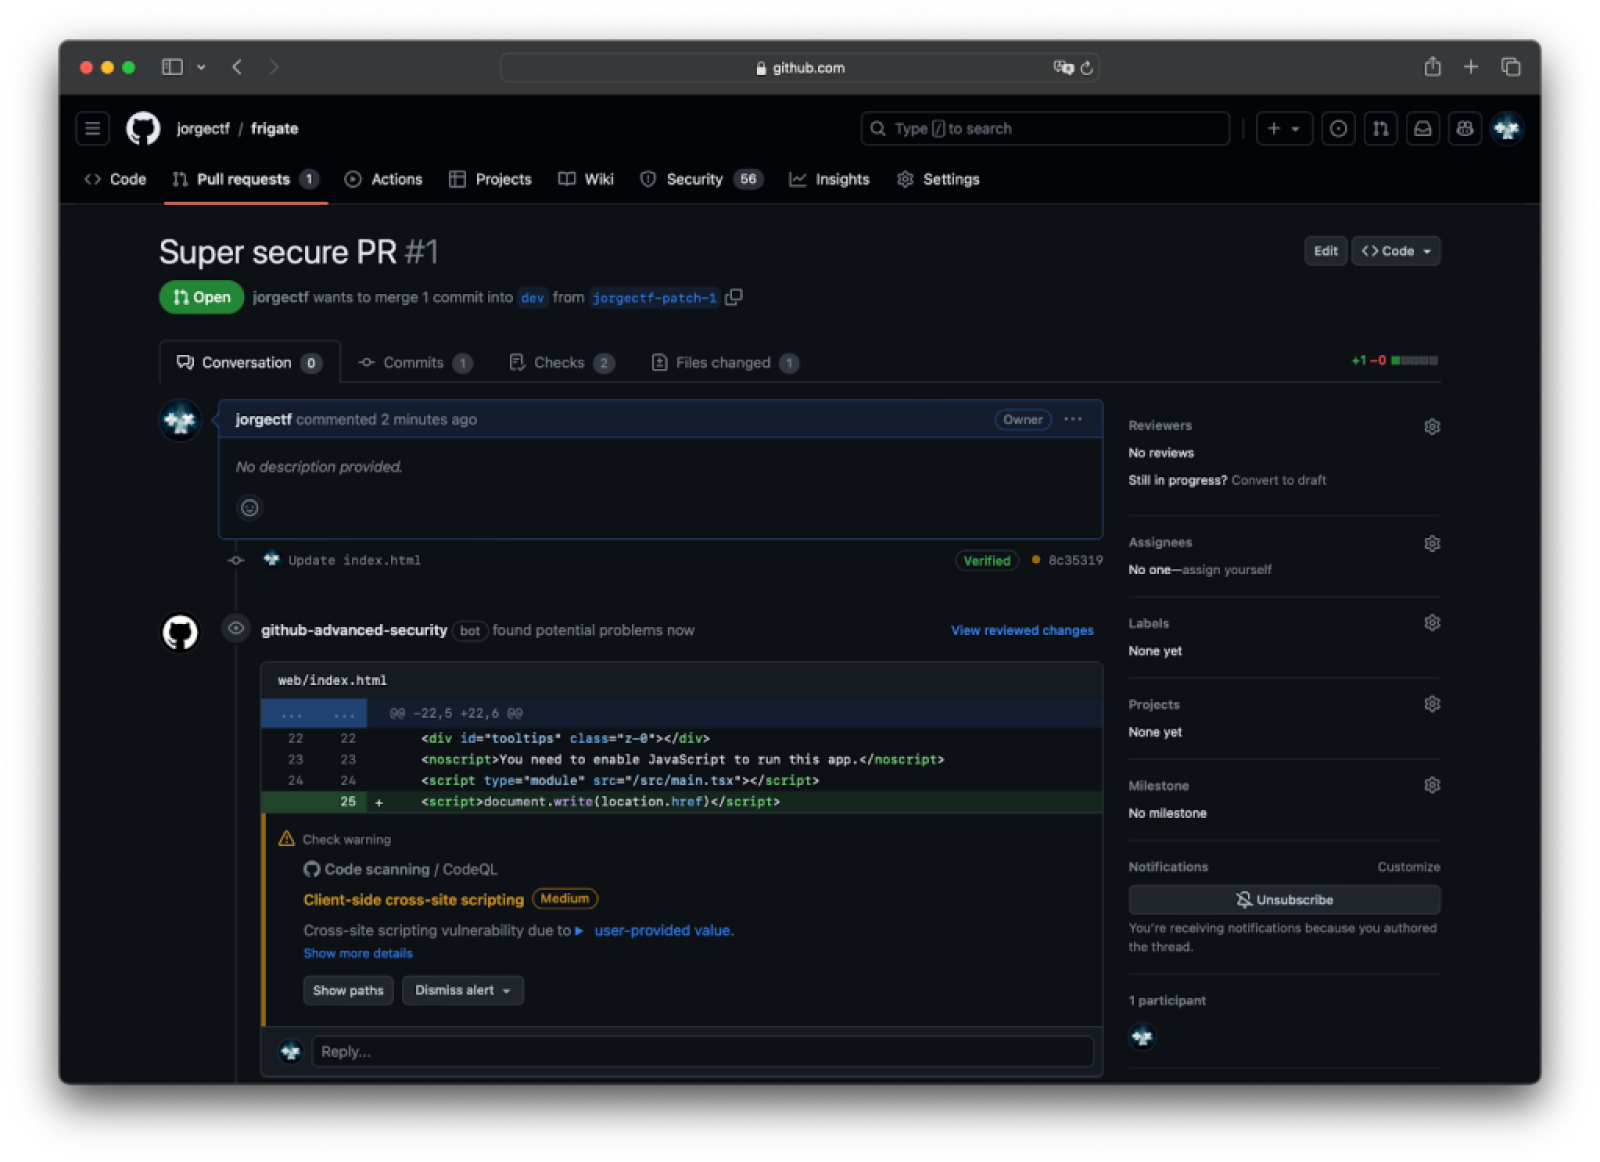
When code scanning is “connected” with a static analysis tool like GitHub’s CodeQL, that’s when the magic happens, but we will get there in a moment.
CodeQL is the static code analysis engine developed by GitHub to automate security checks. CodeQL performs semantic and dataflow analysis, “letting you query code as though it were data.” CodeQL’s learning curve at the start can be a little bit steep, but absolutely worth the effort, as its dataflow libraries allow for a solution to any kind of situation.
|
Learning CodeQL If you are interested in learning more about the world of static analysis, with exercises and more, go ahead and follow @sylwia-budzynska’s CodeQL zero to hero series. You may also want to join GitHub Security Lab’s Slack instance to hang out with CodeQL engineers and the community. |
Creating the CodeQL workflow file
GitHub engineers are doing a fantastic job on making CodeQL analysis available in a one-click fashion. However, to learn what’s going on behind the scenes (because we are researchers 😎), we are going to do the manual setup.
|
Running CodeQL at scale In this case, we are using CodeQL on a per-repository basis. If you are interested in running CodeQL at scale to hunt zero day vulnerabilities and their variants across repositories, feel free to learn more about Multi-repository Variant Analysis. In fact, the Security Lab has done some work to run CodeQL on more than 1k repositories at once! |
In order to create the workflow file, follow these steps:
- Visit your fork
For security and simplicity reasons, we are going to remove the existing GitHub Actions workflows so we do not run unwanted workflows. To do so, we are going to use github.dev (GitHub’s web-based editor). For such code changes, that don’t require reviews, rebuild, or testing, simply browse to
/.github/workflows, press the.(dot) key once and a VS Code editor will pop-up in your browser.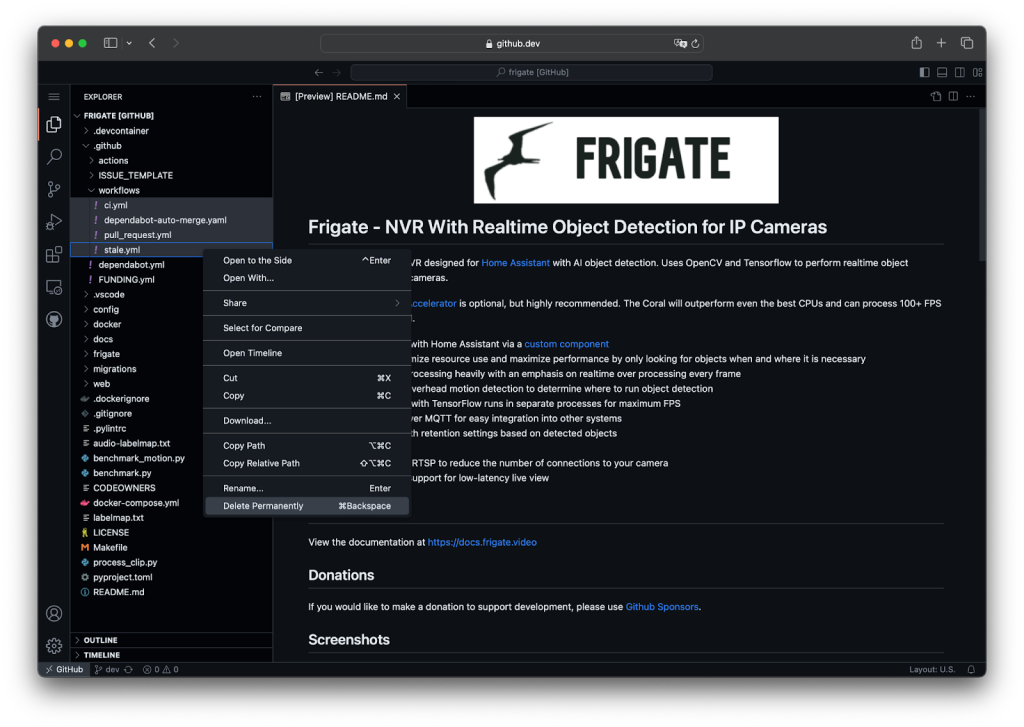
And push the changes:
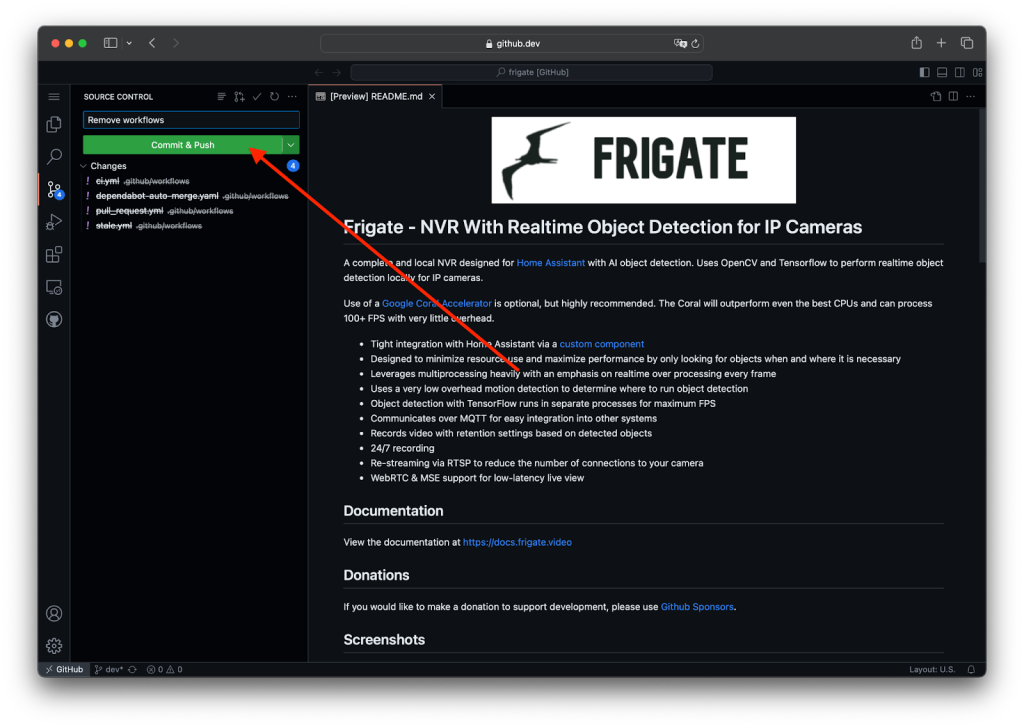
-
Enable GitHub Actions (optional)
Head to the GitHub Actions tab and click on “I understand my workflows, go ahead and enable them.”Note that this might not appear if you deleted all workflows previously.
-
Head to the Security tab
- Click on “Code Scanning”
- Click “Configure scanning tool”
-
In CodeQL analysis, click “Set up” and then click “Advanced”
Now, you are guided to GitHub’s UI file editor with a custom workflow file (whose source is located at actions/starter-workflows) for the CodeQL Action. You can notice it is fully customized for this repository by looking at the
on.push.branchesandstrategy.matrix.languagevalues.
|
Actions documentation |
At first glance, we can see that there’s an analyze job that will run for each language defined in the workflow. The analyze job will:
- Clone the repository
- Initialize CodeQL
In this step,
github/codeql-action/initwill download the latest release of CodeQL, or CodeQL packs, that are not available locally. -
Autobuild
The autobuild step will try to automatically build the code present in the workspace (step 1) in order to populate a database for later analysis. If it’s not a compiled language, it will just succeed and continue.
-
Analyze
The CodeQL binary will be called to finalize the CodeQL database and run queries on it, which may take a few minutes.
Advanced configuration using Security Lab’s Community QL Packs
With CodeQL’s default configuration (default workflow), you will already find impactful issues. Our CodeQL team makes sure that these default queries are designed to have a very low false positive rate so that developers can confidently add them to their CI/CD pipeline. However, if you are a security team like the GitHub Security Lab, you may prefer using a different set of audit models and queries that have a low false negative rate, or community-powered models customized for your specific target or methodology. With that in mind, we recently published our CodeQL Community Packs, and using it is as easy as a one-liner in your workflow file.
As the README outlines, we just need to add a packs variable in the Initialize CodeQL step:
- name: Initialize CodeQL
   uses: github/codeql-action/init@v2
   with:
     languages: ${{ matrix.language }}
     packs: githubsecuritylab/codeql-${{ matrix.language }}-queries
Once done, we are ready to save the file and browse the results! For more information on customizing the scan configuration, refer to the documentation. The bit I find most interesting is Using a custom configuration file.
Browsing alerts
A few minutes in, the results are shown in the Security tab; let’s dig in!

Anatomy of a code scanning alert
While you may think that running CodeQL locally would be easier, code scanning provides additional built-in mechanisms to avoid duplicated alerts, prioritize, or dismiss them. Also, the amount of information given by a single alert page can save you a lot of time!
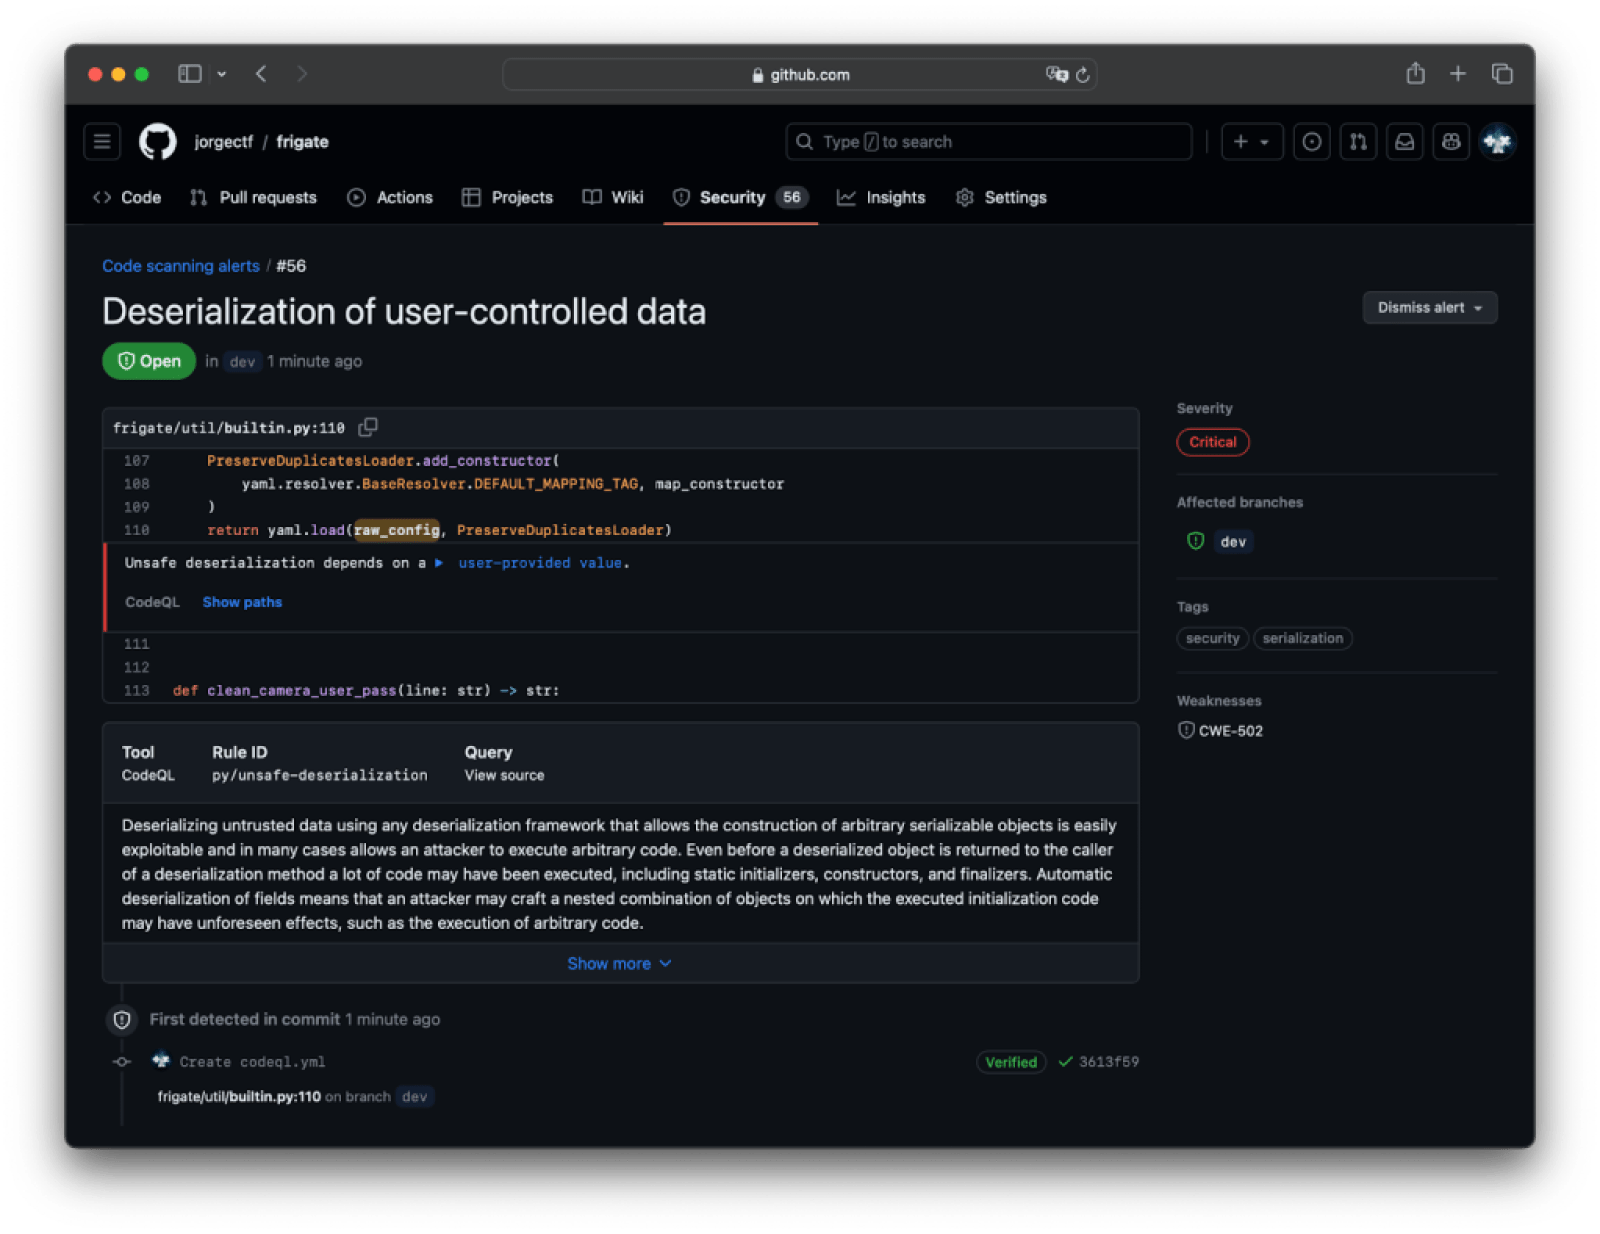
In a few seconds, this view answers a few questions: what, where, when, and how. Even though we can see a few lines surrounding the sink, we need to see the whole flow to determine whether we want to pursue the exploitation further. For that, click Show paths.
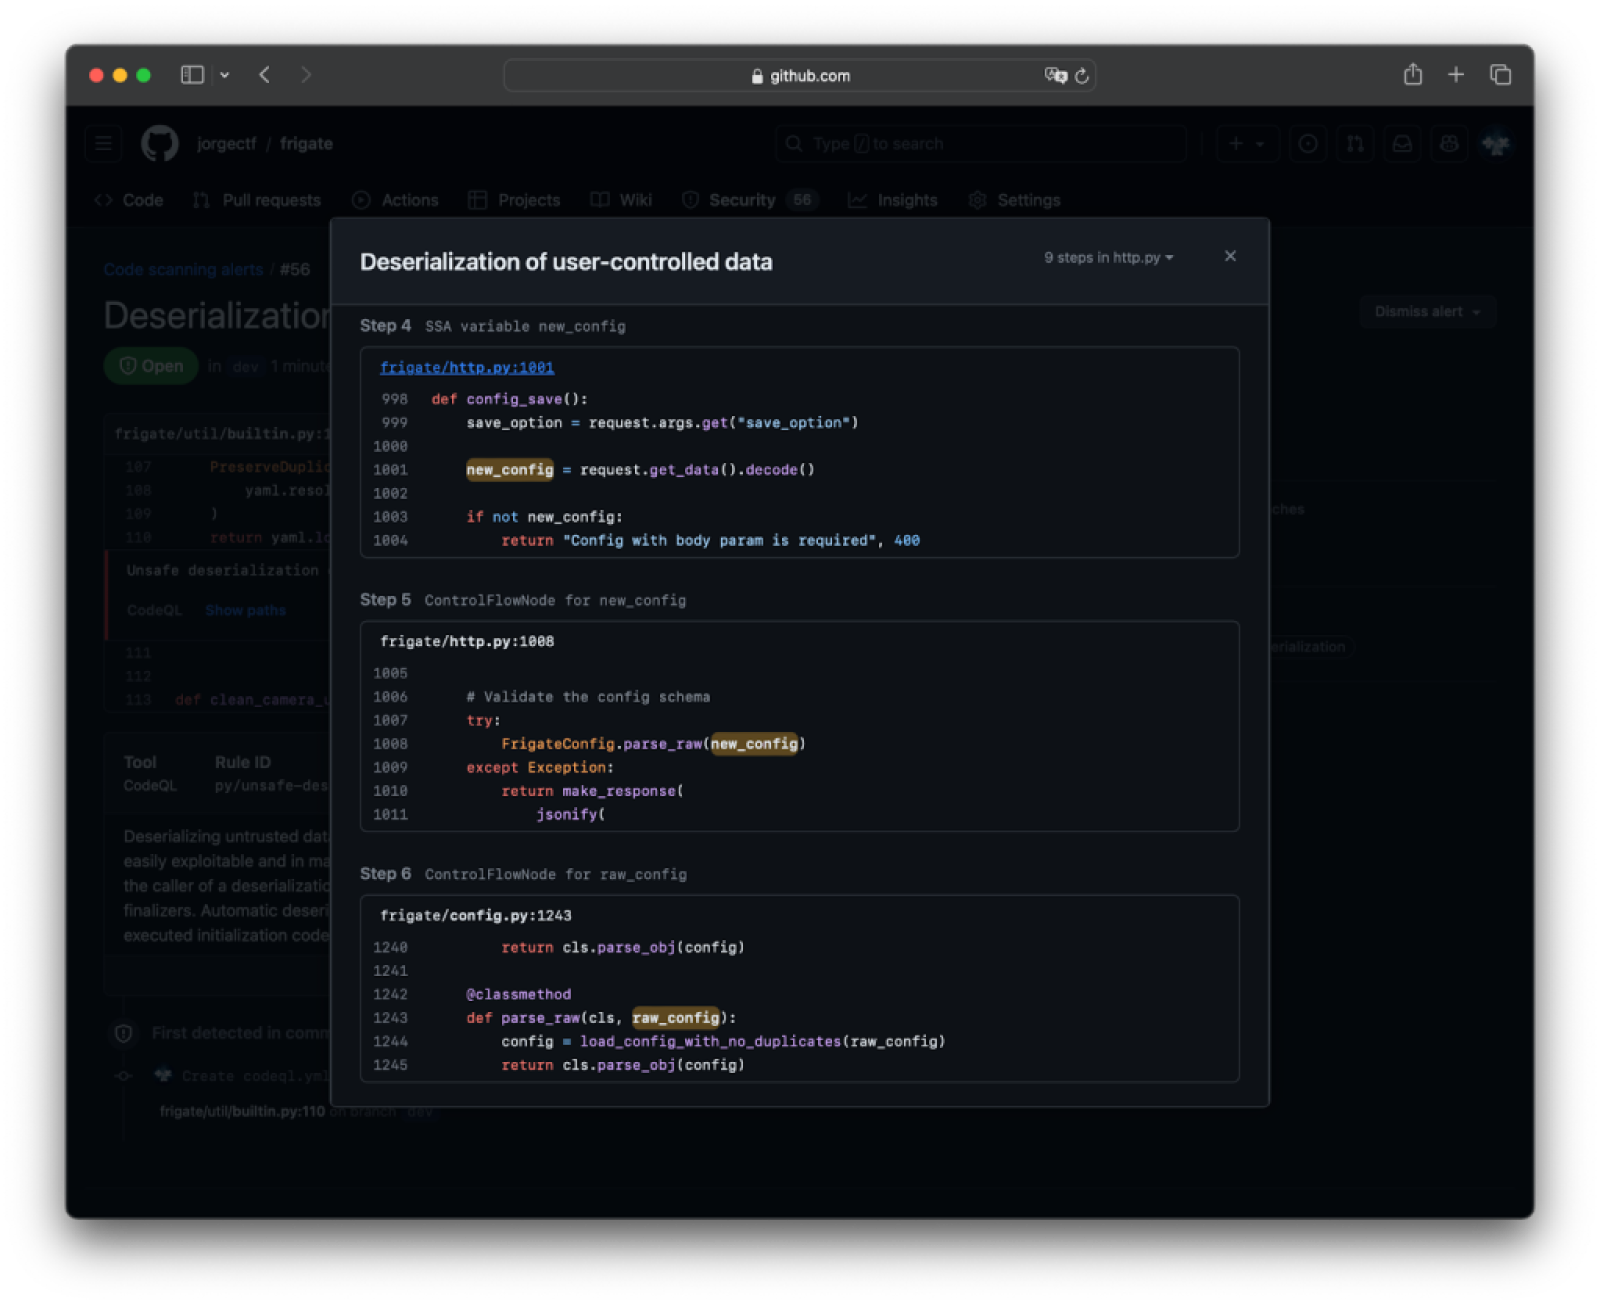
In this view, we can see that the flow of the vulnerability begins from a user-controllable node (in CodeQL-fu, RemoteFlowSource), which flows without sanitizers to a known PyYaml’s sink.
Digging into the alert
Looking at the alert page and the flow paths alone isn’t enough information to guess whether this will be exploitable. While new_config is clearly something we could control, we don’t know the specifics of the Loader that yaml.load is using. A custom Loader can inherit quite a few kinds of Loaders, so we need to make sure that the inherited Loader allows for custom constructors.
def load_config_with_no_duplicates(raw_config) -> dict:
    """Get config ensuring duplicate keys are not allowed."""

    class PreserveDuplicatesLoader(yaml.loader.Loader):
        pass

  ...

    return yaml.load(raw_config, PreserveDuplicatesLoader)
However, we know CodeQL uses dataflow for its queries, so it should already have checked the Loader type, right?
The community helps CodeQL get better
When we were writing the post about Frigate’s audit, we came across a new alert for the vulnerability we had just helped fix!

Our fix suggestion was to change the Loader from yaml.loader.Loader to yaml.loader.SafeLoader, but it turns out that although CodeQL was accounting for a few known safe loaders, it was not accounting for classes inheriting these. Due to this, code scanning didn’t close the alert we reported.
The world of security is huge and evolving everyday. That is, supporting every source, sanitizer, and sink that exists for each one of the queries is impossible. Security requires collaboration between developers and security experts, and we encourage everyone who uses CodeQL to collaborate in any of the following forms to bring back to the community:
- Report the False Positives in github/codeql: CodeQL engineers and members of the community are actively monitoring these. When we came across the false positive explained before, we opened github/codeql#14685.
- Suggest new models for the Security Lab’s CodeQL Community Packs: Whether you’re inclined to contribute by crafting a pull request introducing novel models or queries or by opening an Issue to share your model or query concepts, you are already having a huge impact on the research community. Furthermore, the repository is also monitored by CodeQL engineers, so your suggestion might make it to the main repository impacting a huge amount of users and enterprises. Your engagement is more impactful than you might think.
|
CodeQL model editor If you are interested in learning about supporting new dependencies with CodeQL, please see the CodeQL model editor. The model editor is designed to help you model external dependencies of your codebase that are not supported by the standard CodeQL Libraries. |
Now that we are sure about the exploitability of the issue, we can move on to the exploitation phase.
GitHub Codespaces
Codespaces is GitHub’s solution for cloud, instant and customizable development environments based on Visual Studio Code. In this post, we will be using Codespaces as our exploitation environment due to its safe (isolated) and ephemeral nature, as we are one click away from creating and deleting a codespace. Although this feature has its own billing, we will be using the free 120 core hours per month.
Creating a codespace
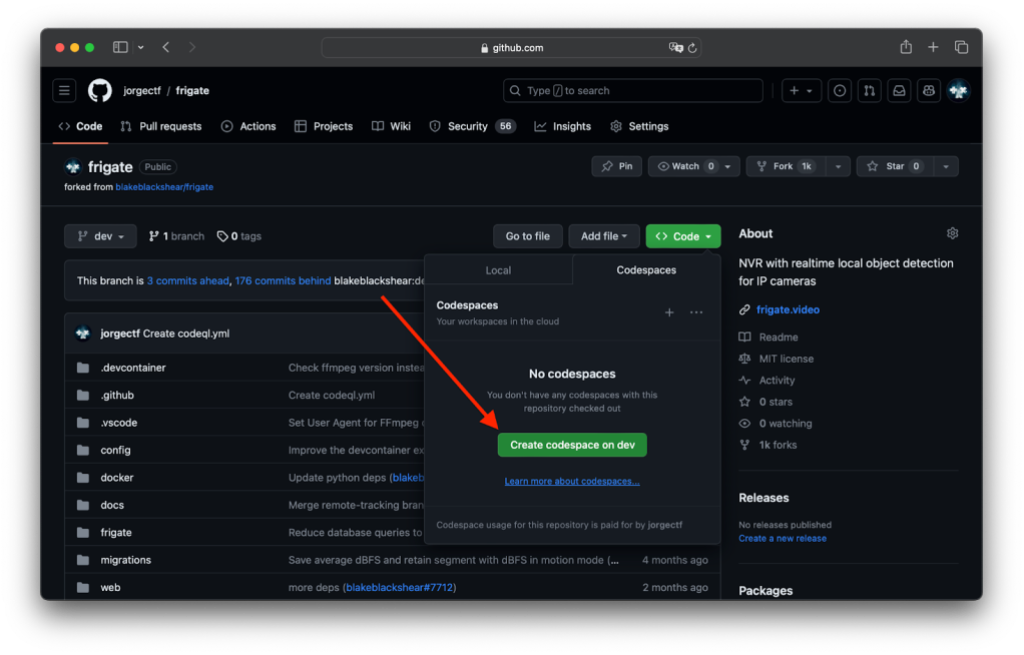
I wasn’t kidding when I said “we are one click away from creating and deleting a codespace”—simply go to “Code” and click “Create codespace on dev.” Fortunately for us, Frigate maintainers have helpfully developed a custom devcontainer configuration for seamless integration with VSCode (and so, Codespaces).
|
Customizing devcontainer configuration For more information about .devcontainer customization, refer to the documentation.
|
Once loaded, I suggest you close the current browser tab and instead connect to the Codespaces using VSCode along with the Remote Explorer extension. With that set up, we have a fully integrated environment with built-in port forwarding.
Set up for debugging and exploitation
When performing security research, having a full setup ready for debugging can be a game changer. In most cases, exploiting the vulnerability requires analyzing how the application processes and reacts to your interactions, which can be impossible without debugging.
Debugging
Right after creating the codespace we can see that it failed:
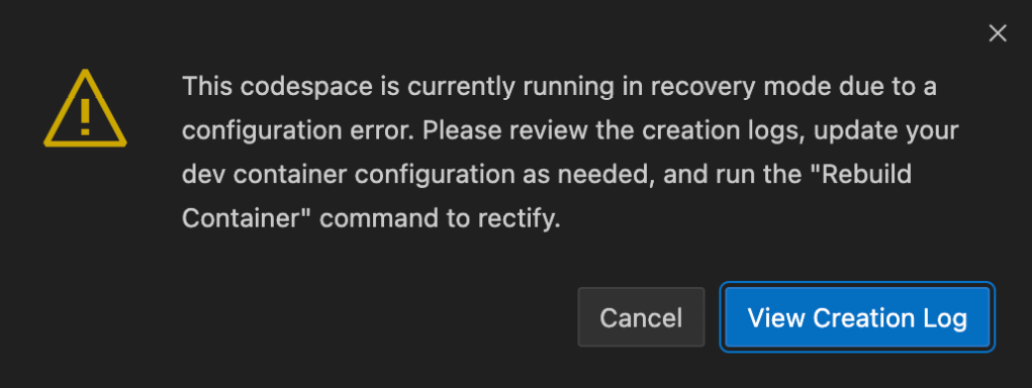
Given that there is an extensive devcontainer configuration, we can guess that it was not made for Codespaces, but for a local VSCode installation not meant to be used in the cloud. Clicking “View Creation Log” helps us find out that Docker is trying to find a non-existing device:
ERROR: for frigate-devcontainer - Cannot start service devcontainer: error gathering device information while adding custom device "/dev/bus/usb": no such file or directory
We need to head to the docker-compose.yml file (/workspaces/frigate/docker-compose.yml) and comment the following out:
- The
devicesproperty - The
deployproperty - The
/dev/bus/usbvolume
Afterwards, we go to /workspaces/frigate/.devcontainer/post_create.sh and remove lines 5-9.
After the change, we can successfully rebuild the container:
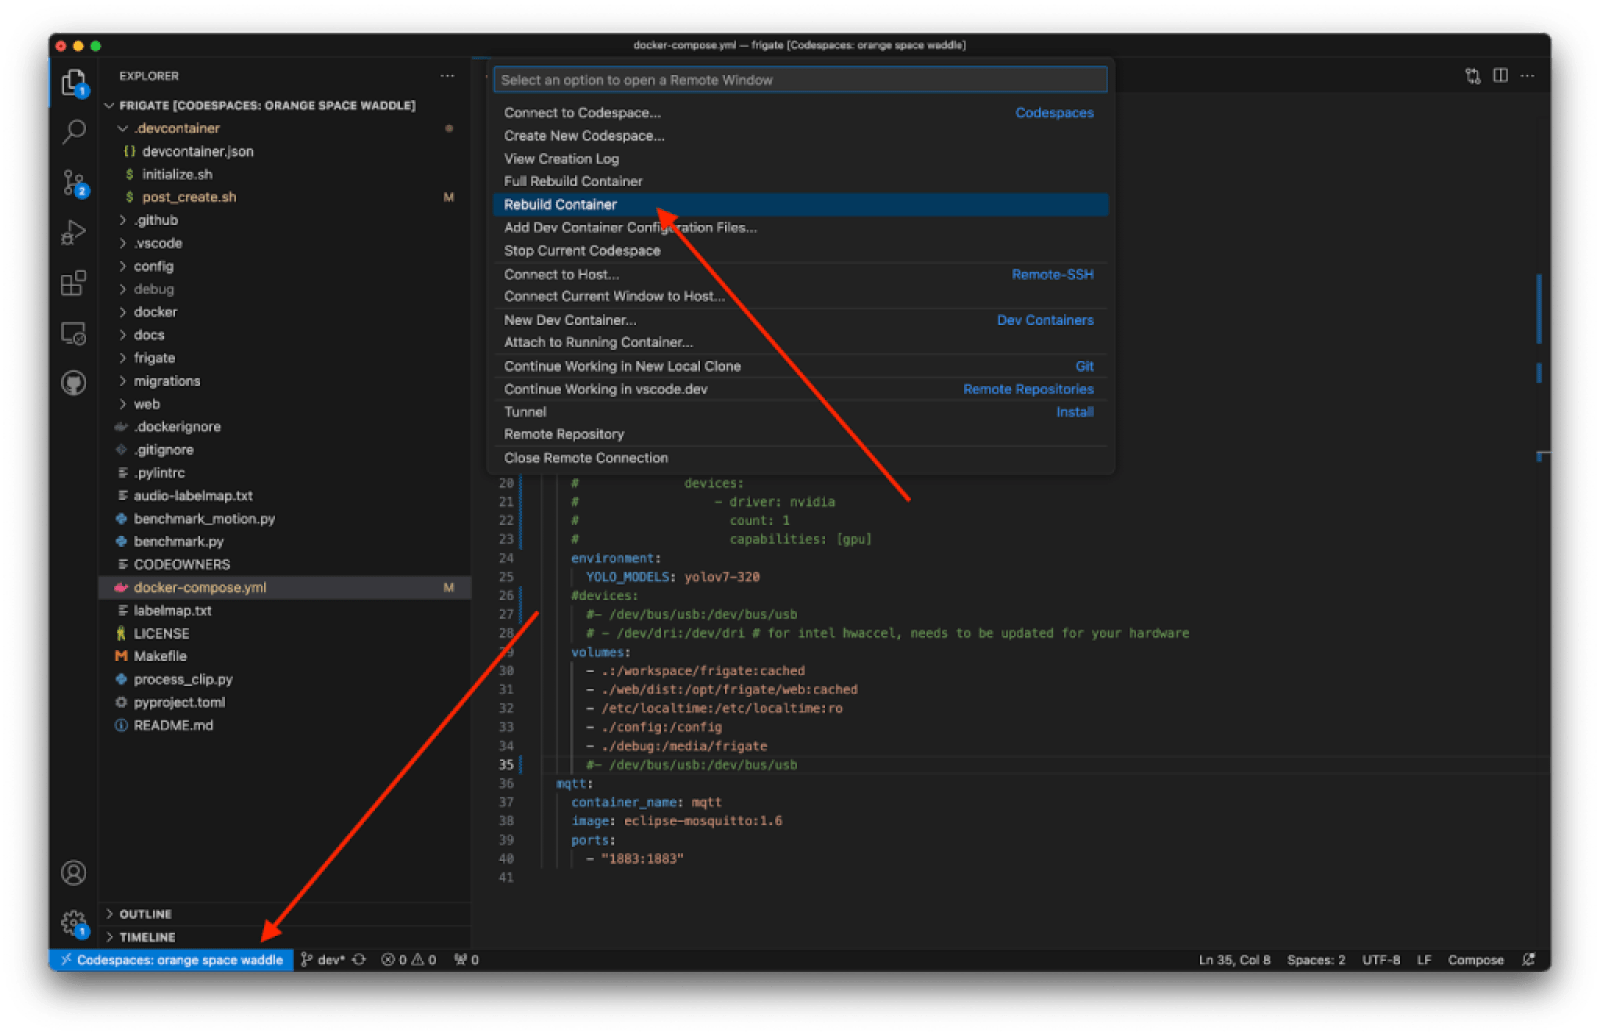
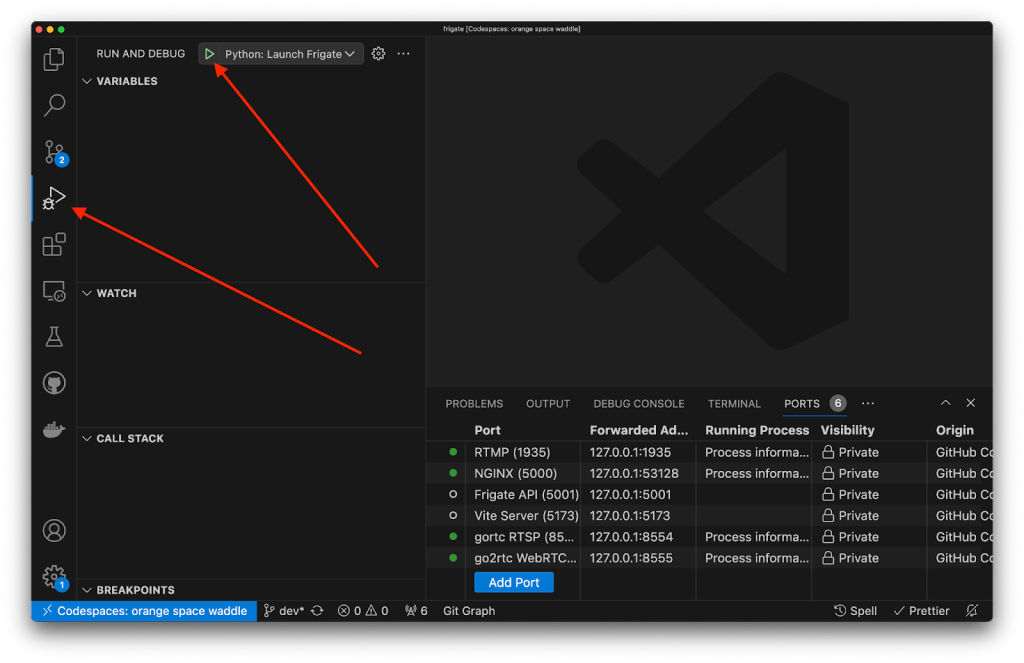
Once rebuilt, we can see 6 ports in the port forwarding section. However, Frigate API, the one we are targeting through nginx, is not active. To solve that, we can start debugging by heading to the “Run and Debug” (left) panel and click the green (play-like) button to start debugging Frigate.
Exploitation
The built-in port forwarding feature allows us to use network-related software like Burp Suite or Caido right from our native host, so we can send the following request:
POST /api/config/save HTTP/1.1
Host: 127.0.0.1:53128
Content-Length: 50

!!python/object/apply:os.popen
- touch /tmp/pwned
Using the debugging setup, we can analyze how new_config flows to yaml.load and creates the /tmp/pwned file.
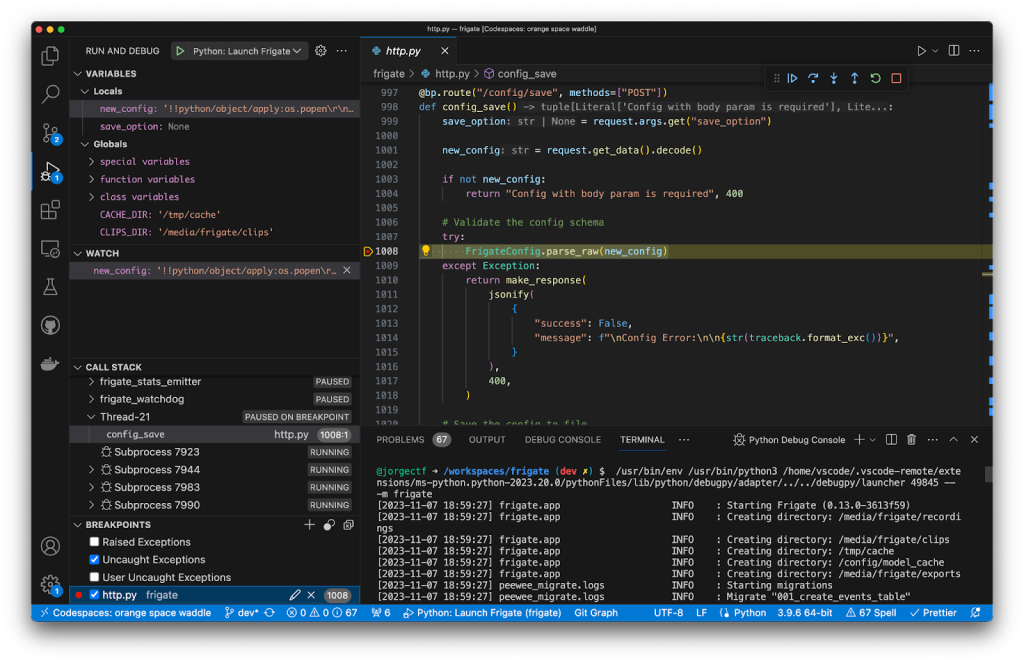
Now that we have a valid exploit to prove the vulnerability, we are ready to report it to the project.
Private vulnerability reporting

Reporting vulnerabilities in open source projects has never been an easy subject for many reasons: finding a private way of communicating with maintainers, getting their reply, and agreeing on so-many topics that a vulnerability covers is quite challenging on a text-based channel. That is what private vulnerability reporting (PVR) solves: a single, private, interactive place in which security researchers and maintainers work together to make their software more secure, and their dependent consumers more aware.
|
Closing the loop Published advisories resulting from private vulnerability reports can be included in the GitHub Advisory Database to automatically disclose your report to end users using Dependabot! |
Note that GitHub has chosen to introduce this feature in an opt-in manner, aligning with our developer-first philosophy. This approach grants project maintainers the autonomy to decide whether they wish to participate in this reporting experience. That said, tell your favorite maintainers to enable PVR! You can find inspiration in the issues we open when we can’t find a secure and private way of reporting a vulnerability.
Sending the report
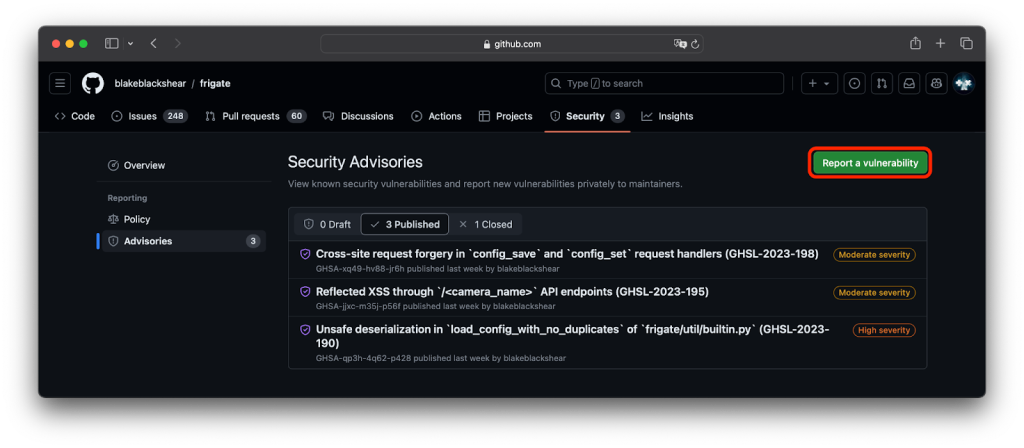
Once we validated the vulnerability and built a proof of concept (PoC), we can use private vulnerability reporting to privately communicate with Frigate maintainers.
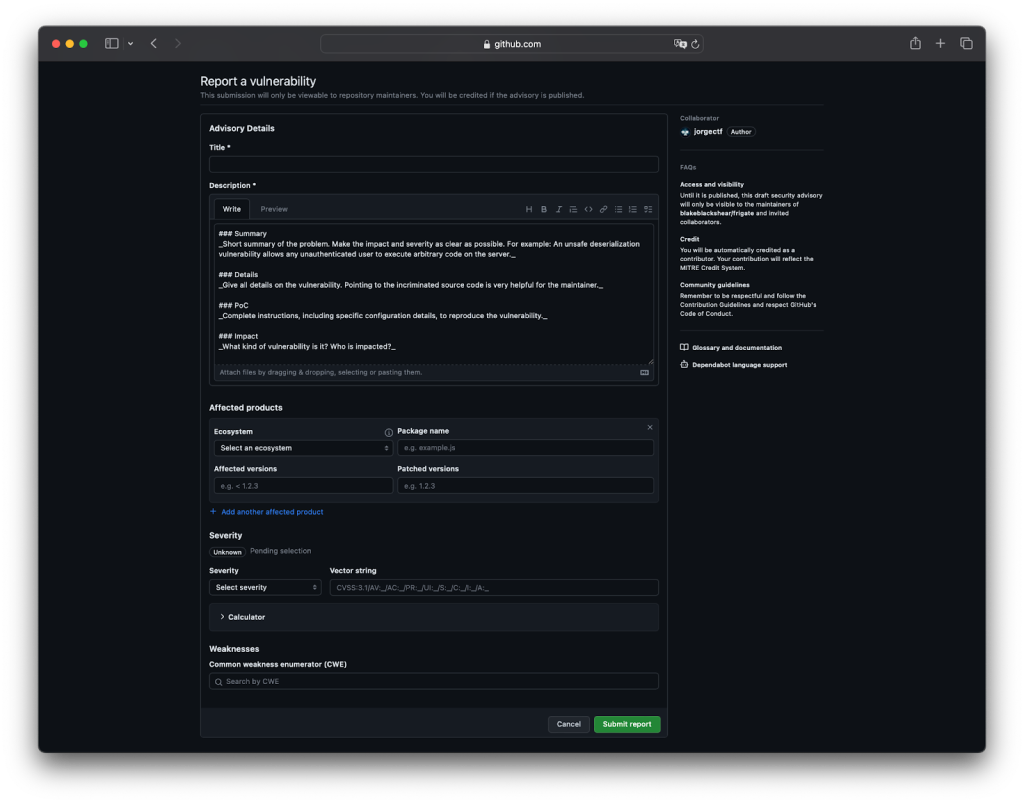
This feature allows for special values like affected products, custom CVSS severity, linking a CWE and assigning credits with defined roles, ensuring precise documentation and proper recognition, crucial for a collaborative and effective security community.
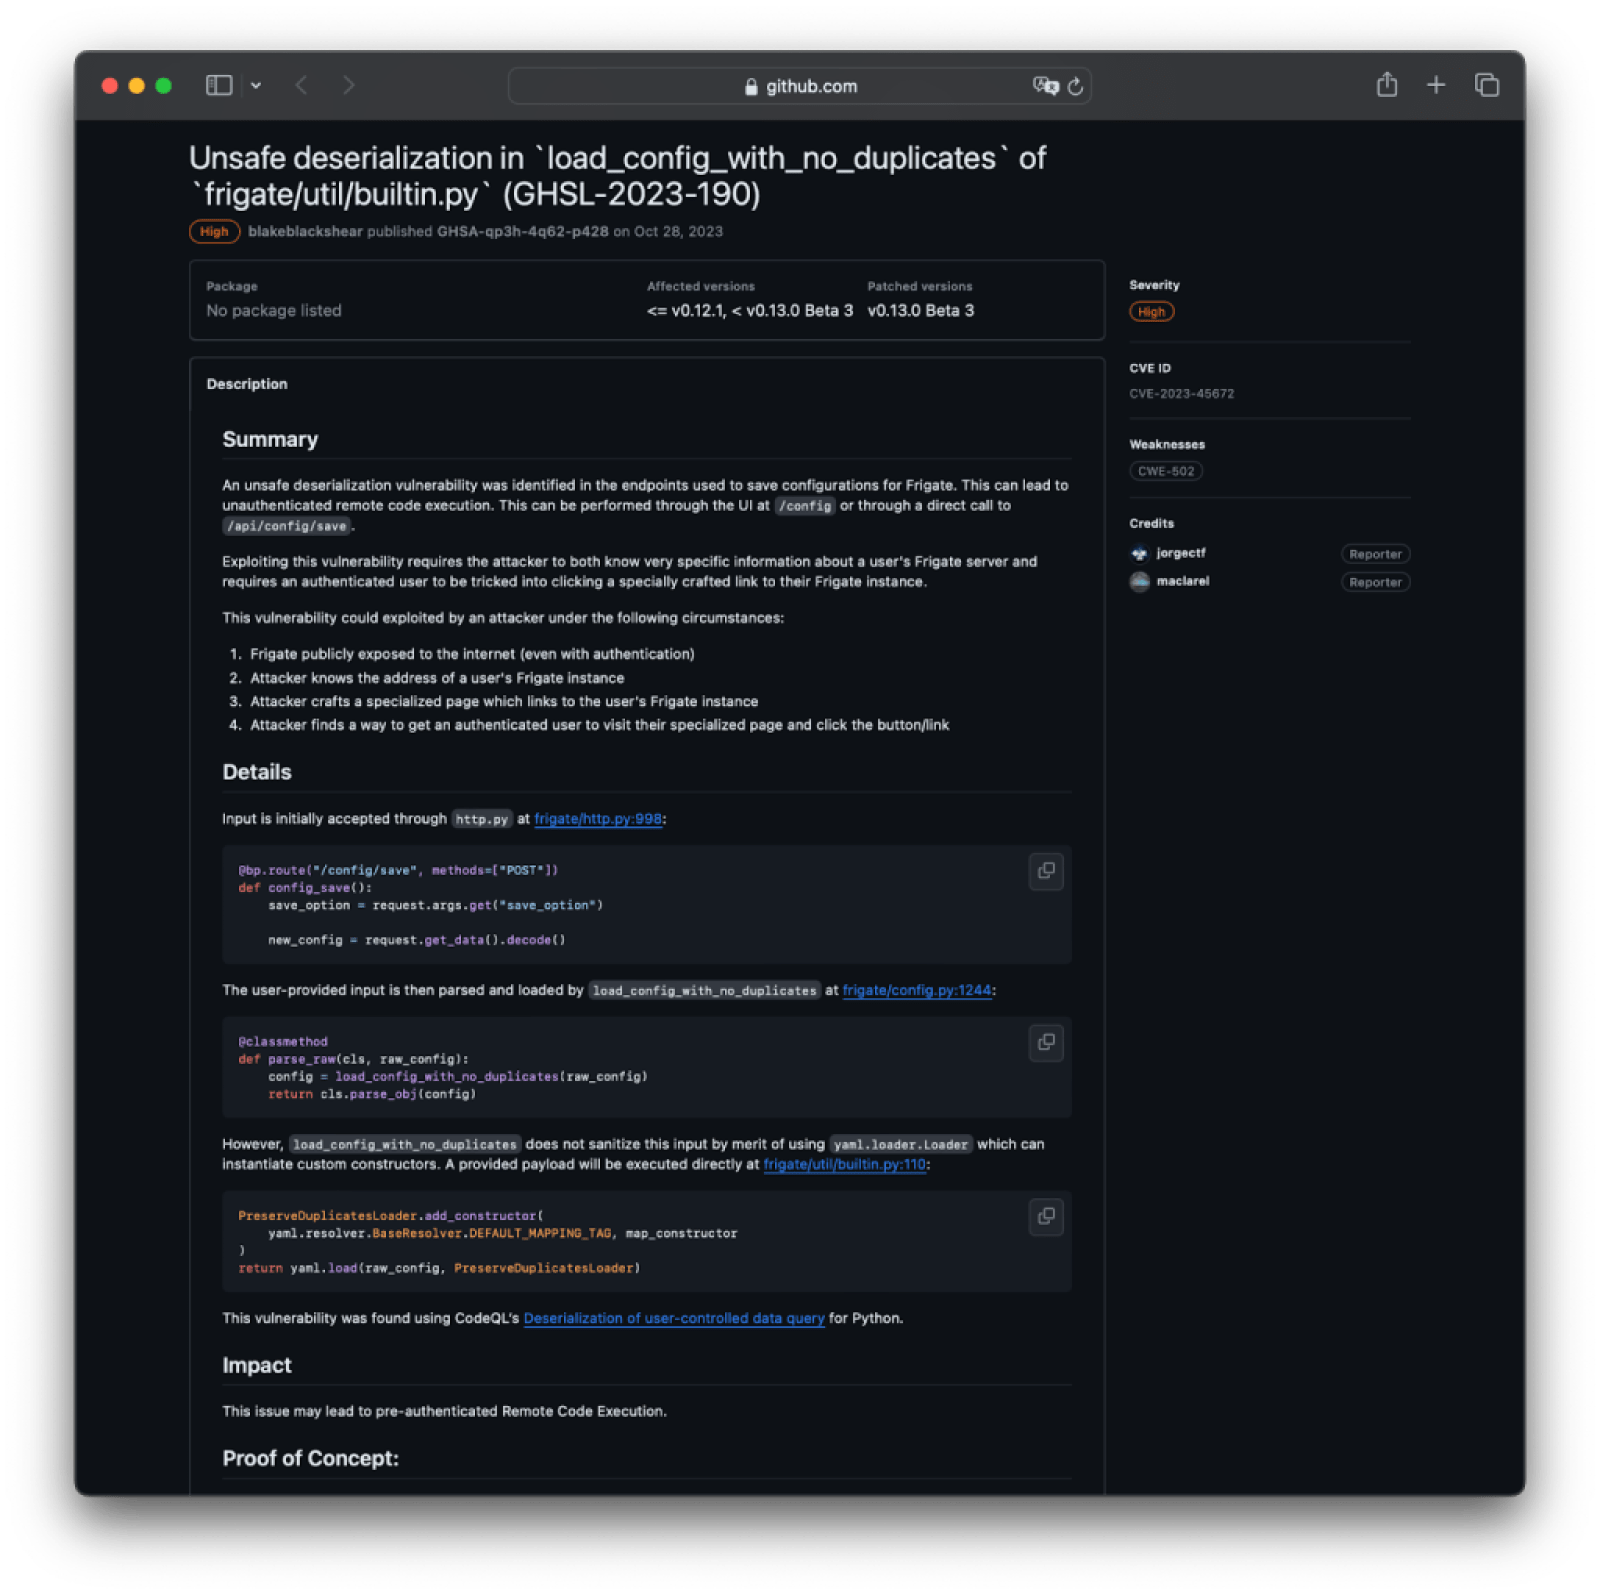
Once reported, it allows for both ends (reporter and maintainer) to collaborate on a chat, and code together in a temporary private fork. On the maintainer side, they are one click away from requesting a CVE, which generally takes just two days to get created.

For more information on PVR, refer to the documentation.
GitHub and security research
In today’s tech-driven environment, GitHub serves as a valuable resource for security researchers. With tools such as code scanning, Codespaces, and private vulnerability reporting seamlessly integrated into the platform, researchers can effectively identify and address vulnerabilities end to end.
This comprehensive strategy not only makes research easier but also enhances the global cybersecurity community. By offering a secure, collaborative, and efficient platform to spot and tackle potential threats, GitHub empowers both seasoned security professionals and aspiring researchers. It’s the go-to destination for boosting security and keeping up with the constantly changing threat landscape.
Happy coding and research!
Tags:
Written by
Related posts

Understand your software’s supply chain with GitHub’s dependency graph
The GitHub dependency graph maps every direct and transitive dependency in your project, so you can identify risks, prioritize fixes, and keep your code secure.

GitHub Advisory Database by the numbers: Known security vulnerabilities and what you can do about them
Use these insights to automate software security (where possible) to keep your projects safe.

Hack the model: Build AI security skills with the GitHub Secure Code Game
Dive into the novel security challenges AI introduces with the open source game that over 10,000 developers have used to sharpen their skills.