How GitHub Actions renders large-scale logs
Rendering logs in a web UI might seem simple: they are just lines of plain text. However, there are a lot of additional features that make them more useful to…

Rendering logs in a web UI might seem simple: they are just lines of plain text. However, there are a lot of additional features that make them more useful to our users: coloring, grouping, search, permalinks, etc. but most importantly, the interface should work no matter if the log has ten or tens of thousands of lines. This was something we had to prioritize from the beginning when we made GitHub Actions GA in 2019. We didn’t have usage metrics at that time, but it was obvious we had to deal with the case of very large log lines. The browser could freeze in the initial load, or it could be completely unusable if we didn’t tackle this problem correctly. We had to make use of a technique called virtualization.
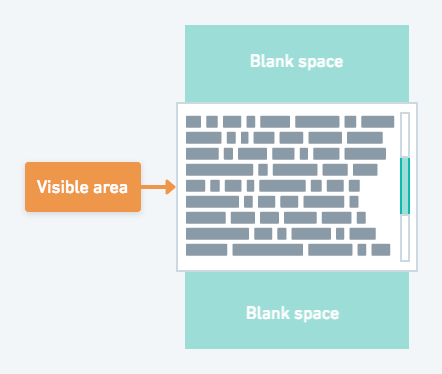
Virtualization consists of rendering only a subset of the information in a list, to make the UI behave seamlessly without the user noticing that there’s data out of the visible viewport that is not yet rendered. It requires updating the visible content when the user scrolls, calculating layout positions even when not all the information is rendered to keep the scrolling experience smooth and much more.
Initial implementation
When we first launched GitHub Actions, we tested with a React-based library and also a vanilla JavaScript one. Some of the libraries have hard limitations because of the way they are implemented. For example, many libraries require that all items rendered in the screen have a fixed height. This constraint makes the calculations a lot easier for them, because if a user wants to scroll to a specified item (visible or not), they just have to multiply item_index * items_height to calculate the position, and then scroll to it. Also, in order to calculate the whole scrollable height, they can do something similar items_count * items_height. That’s it! Of course in many cases not all elements have the same height, making this limitation not acceptable. In the case of GitHub Actions, we wanted to break long log lines, which meant we had to support log lines with variable height.
We ended up choosing a vanilla JavaScript library that had most of the functionality we wanted: the ability to have variable element heights, to scroll to an item, etc. However, we started to see limitations with bugs and poor UX experiences for variety of reasons:
- The scrollable area should have a fixed height which is another typical limitation that makes the internal implementation easy. But in our case, this made the UX experience poor, especially because in our logs, one job will have multiple steps and each step has its own virtualization. This meant the page had to have individual scrolling areas for each step along with the scrollbar for the whole page.
- It was not very well tested for cases where the virtualized list had to switch its visibility from hidden to visible. For GitHub Actions, we allow users to expand and collapse steps, as well as expand logs automatically. We began to see there was a bug when a step started running. When we automatically expanded the logs to make them visible, and the browser tab was not visible at that moment, sometimes users weren’t able to properly see the logs when they came back to the browser tab.
- Users weren’t able to select text and scroll at the same time because the selection would end up being removed from the DOM due to the virtualization.
- In some cases, the experience was slow because we had to render log lines in the background in order to calculate their height. The virtualization wasn’t helping much and we were actually rendering some lines twice instead of not rendering them at all. But, we had to do it this way because incorrect height calculations led to log lines being cut off in the UI.
Rethinking our logs experience based on real usage
For all these reasons, we decided to revamp the log experience. We started with a question: do we still need virtualization? As noted, we didn’t have metrics about usage at launch, but now we were able to make decisions based on real usage. For example, we could remove virtualization if the vast majority of our users had logs that were small enough to render them without, but allow larger logs to be downloaded separately.
Our data showed us that 99.51% of existing jobs had less than 50k lines, but we knew that browsers start struggling with more than 20k log lines. We also found that even if there is a low number of log lines, it was possible that it could take up too much space in memory. With all that information, we decided that we didn’t need data virtualization but we did still require UI virtualization. Data virtualization would have required to only load parts of the logs in memory and fetch more information as the user scrolls, but we found that that level of complexity wasn’t necessary. In the very edge case of having a very large log file with a low number of log lines, we truncate it and provide a link to download it.
Writing our own virtualization library from scratch
Once these decisions were made we tried to look for alternative libraries to the one we were using, but none of them suited our needs. We had to make an implementation from scratch. Our goals were:
- Be able to render at least 50k log lines. Ideally on mobile too.
- Allow users to select text without restrictions.
- Make the UI/UX smooth in most cases. Including when jumping between search results or permanent links and streaming logs.
- Have only a single scrollable area without a fixed height.
- Implement sticky headers for steps.
- Make the computations as fast as possible, and use less memory. Not completely accurate calculations are fine.
To reach these goals, we had to approach this a bit different than other libraries in a few areas:
- Estimate heights before rendering: Whereas, most virtualization libraries rely on precise calculations or fixed heights and use absolute positioning to make the implementation very simple, we decided to estimate heights before rendering to avoid costly calculations. We also use relative positioning to avoid log lines being cut off if those calculations are not precise.
- DOM structure: Another challenge was how to structure the DOM for allowing sticky headers and having only one scrollable area. The scrollable container had to contain both but the sticky headers must not be virtualized.
We made a quick implementation to validate our strategy. After some tests generating large logs we found that, while we validated that we could implement our own virtualization meeting all our goals, we had to be careful because it was easy to make wrong decisions and ruin the whole experience. For example, one thing we quickly realized was that rendering as few DOM nodes as possible was important, but it was also important to do as few DOM mutations as possible while scrolling. When the user scrolls, we need to add nodes that become visible and remove nodes that are no longer visible. If the user scrolls fast, especially in mobile devices, there may be too many DOM mutations resulting in a subpar experience.
However, we can fix this in a few ways. For example, you can throttle your code and do the updates in batches and not very frequently. But we found that this approach made the UI less smooth. We came up with the idea of grouping log lines in clusters, so instead of removing and adding individual lines, we put log lines in clusters of N lines and add or remove clusters instead of individual lines. After some tests, we now have an idea of how many lines a cluster would have: 50 lines per cluster.
Production ready
In a week or so, we were able to get an initial implementation that allowed us to see all the benefits in terms of UX. At that point we knew we were on the right path. The next few weeks we worked on other UI/UX improvements and we knew there was a long tail of edge cases we had to deal with.
After a lot of work internally on this, we shipped it to all users and are happy to now offer a superior logs experience: faster, smoother, friendlier, and more cohesive and robust. Most of the time you don’t have to reinvent the wheel, but sometimes the best solution is to implement your own solution from scratch to have the experience and the performance totally under your control.
Tags:
Written by

Related posts

The cost of saying yes has changed
The cost of writing code dropped; the cost of owning it didn’t. A framework for deciding which changes are actually cheap in the AI era.
Better tools made Copilot code review worse. Here’s how we actually improved it.
How migrating Copilot code review to shared Unix-style code exploration tools reduced review cost by reshaping agent workflows around pull request evidence.
Automating cross-repo documentation with GitHub Agentic Workflows
Explore how the Aspire team turns merged product changes into SME-reviewed docs pull requests, closing the gap between release and documentation.