Gauges Daily Summaries and Browser Support
We are excited to announce two new features for Gauges today. Daily Summaries Have you ever wanted a quick snapshot of how your site did the previous day, something to…
We are excited to announce two new features for Gauges today.
Daily Summaries
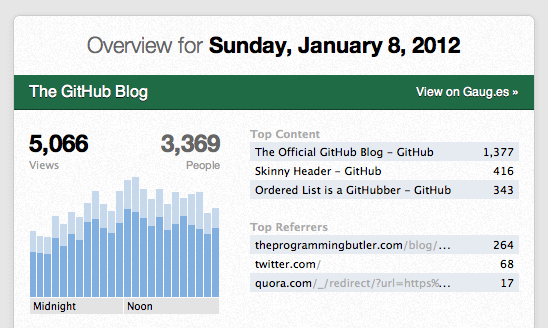
Have you ever wanted a quick snapshot of how your site did the previous day, something to look at during the boring morning commute? Gauges makes that possible with daily summaries for your sites via email. We made them simple and sexy, just the way you like it.
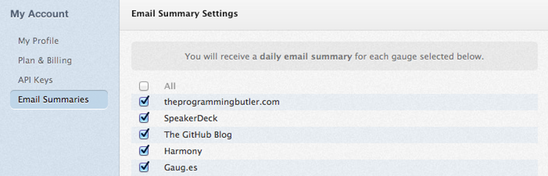
Go to My Account and then Email Summaries to turn on the daily summary for one or more gauges.
Browser Support
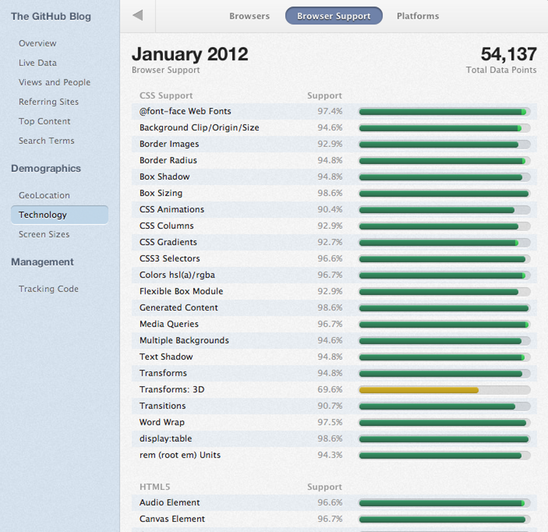
Need to find out what percentage of your users can view CSS animations or use the Javascript File API? Gauges has exactly what you need to find out the percentage of CSS, HTML5, and Javascript features your visitor’s browsers support.
View any gauge and select Technology and then Browser Support to see a graph like the one below.
Written by

Related posts
Developer policy update: Intermediary liability, copyright, and transparency
We’re sharing recent policy updates that developers should know about, updating our Transparency Center with the full year of 2025 data, and looking to what’s ahead.

GitHub availability report: March 2026
In March, we experienced four incidents that resulted in degraded performance across GitHub services.

GitHub Universe is back: We want you to take the stage
Get inspired by five of the most memorable, magical, and quirky Universe sessions to date.