Data Challenge II Results
In April we announced the second annual GitHub data challenge. Since last year, GitHub’s public timeline data on Google BigQuery has grown by over 80 million events, including 3.8 million…
In April we announced the second annual GitHub data challenge.
Since last year, GitHub’s public timeline data on
Google BigQuery has grown by over 80 million events, including
3.8 million new repositories, 38 million pushes, and 8 million comments on issues, pull requests, and commits.
After receiving some amazing entries in the previous
challenge, we were excited to see what people would discover with another year of data. The results blew us away:
we saw many more entrants and novel applications of our data. GitHubbers ranked their favorite entries, and after
tallying the votes, we’re happy to announce the top 3 entries for the 2013 GitHub data challenge.
First Place
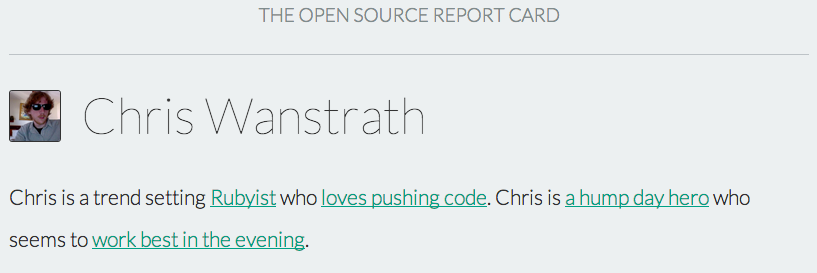
The Open Source Report Card, by Dan Foreman-Mackey, analyzes a GitHub
user’s contributions to produce a “report card” with statistics and automatically generated prose.
Second Place
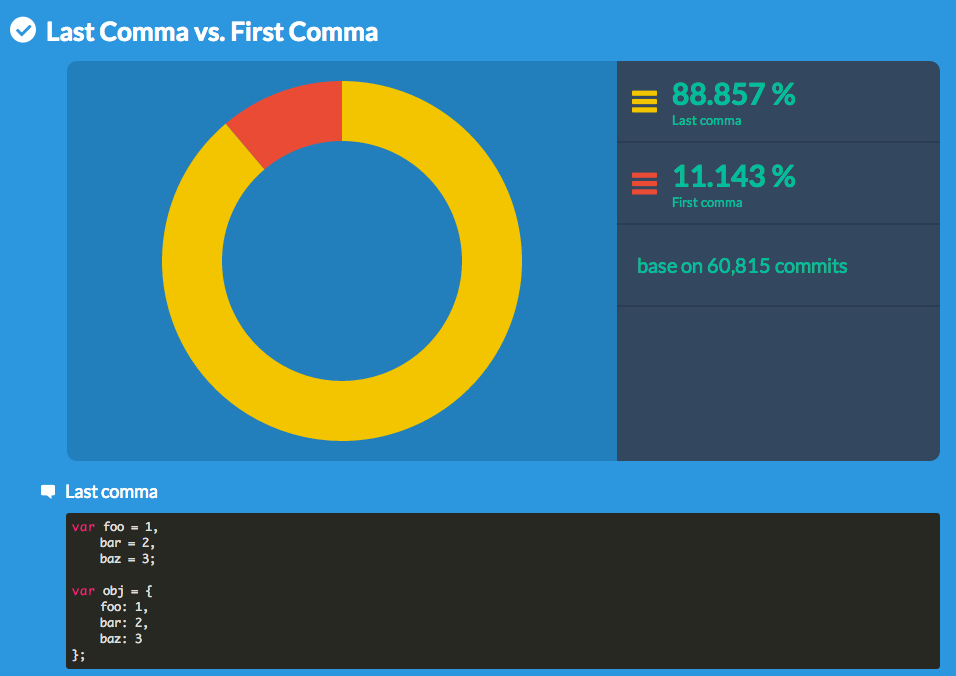
How often do people use tabs over spaces in Java? How many commits have lines wrapped to 80 characters?
Popular Convention by Outsider
uses GitHub data to analyze conventions in selected programming languages.
Third Place
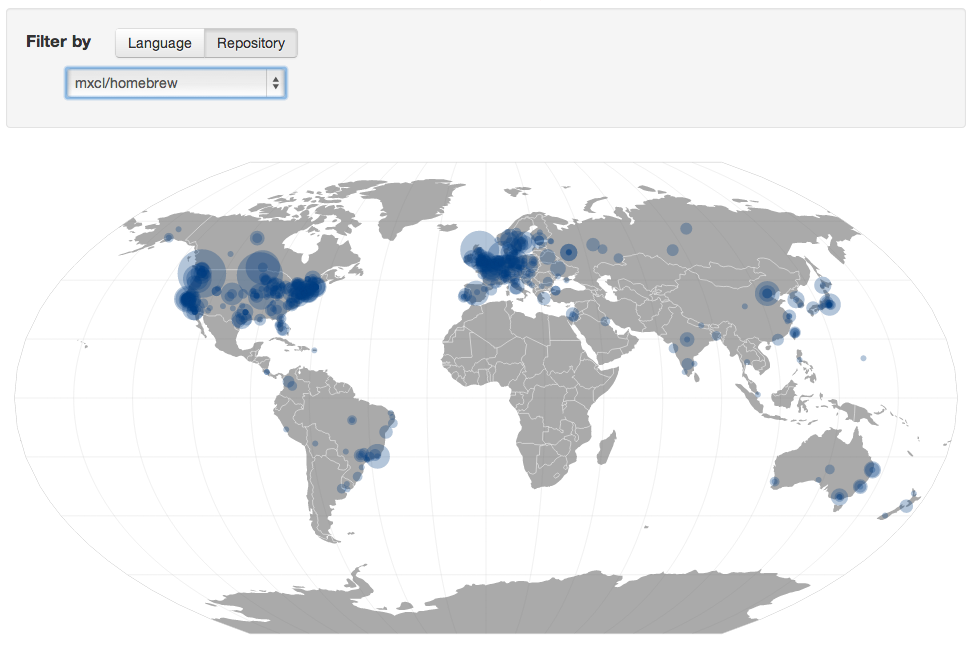
David Fischer’s visualization of
open source contributions by location shows the geographic
distribution of contributors behind the 200 most active GitHub repositories.
Thanks
Congratulations to the winning entries, and huge thanks to everyone who submitted an entry!
Our top
3 winners will receive gift certificates to the GitHub Shop for $200, $100, and $50,
respectively.
We can’t wait to see what the next data challenge will bring!
Written by
Related posts
Year recap and future goals for the GitHub Innovation Graph
Discover the latest trends and insights on public software development activity on GitHub with data from the Innovation Graph through Q3 2025.

Help shape the future of open source in Europe
Read GitHub’s position on the European Open Digital Ecosystem Strategy and learn how to participate.
Build an agent into any app with the GitHub Copilot SDK
Now in technical preview, the GitHub Copilot SDK can plan, invoke tools, edit files, and run commands as a programmable layer you can use in any application.