See your CSVs
Following on the tails of 3D models and geographic data, GitHub.com now also supports rendering tabular data in the form of .csv (comma-separated) and .tsv (tab-separated) files. When viewed, any…
Following on the tails of 3D models and geographic data, GitHub.com now also supports rendering tabular data in the form of .csv (comma-separated) and .tsv (tab-separated) files.
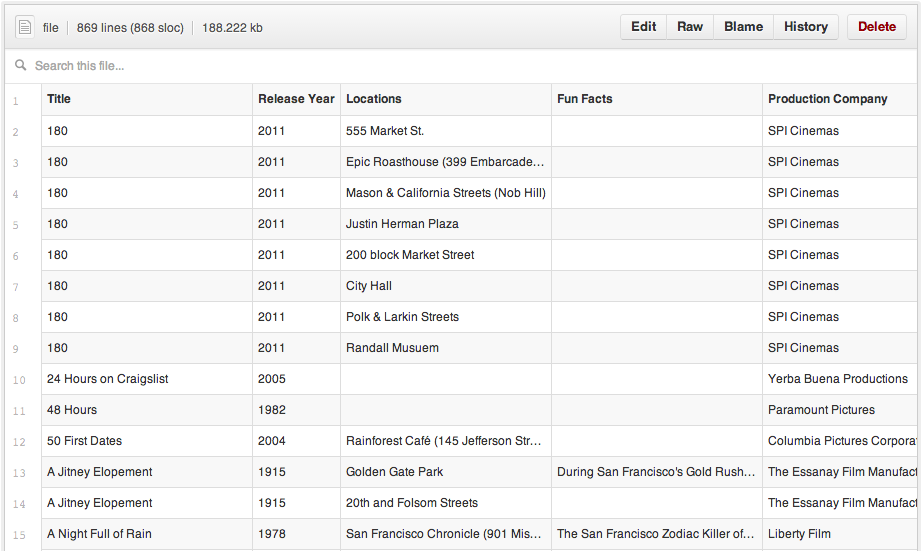
When viewed, any .csv or .tsv file committed to a GitHub repository will automatically render as an interactive table, complete with headers and row numbering.
You can even link to a particular row simply by clicking the row number, or select multiple rows by holding down the shift key. Just copy the URL and send it to a friend.

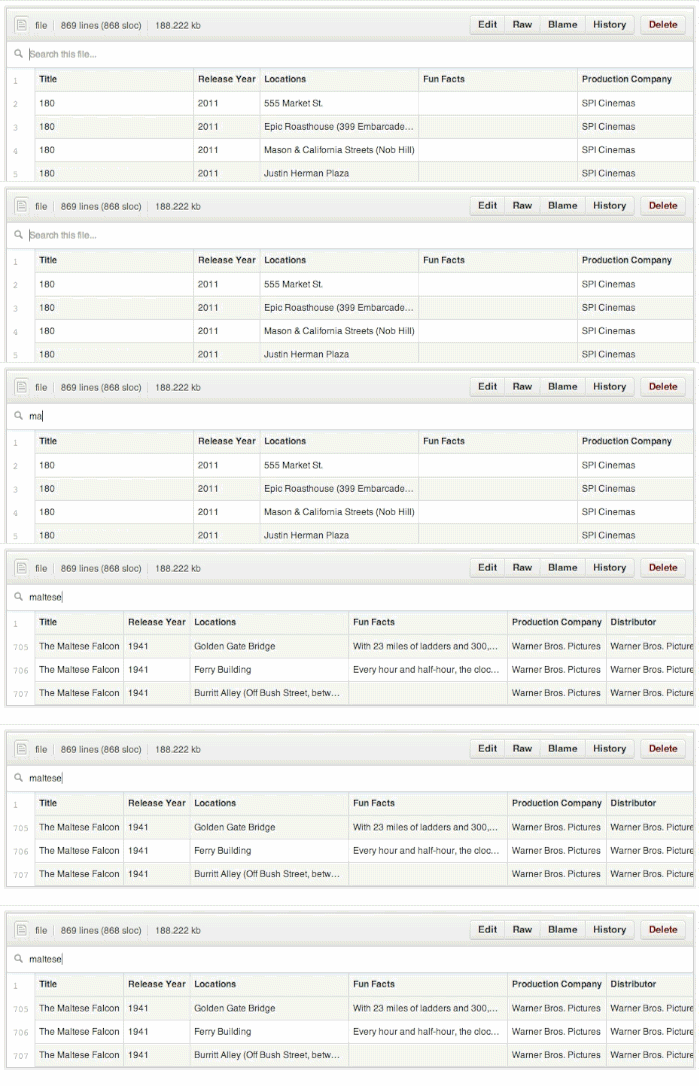
Want to see if a certain value is in your dataset? Just start typing and the data filters itself.
Building software is about more than code. Whether analyzing a government dataset, comparing performance benchmarks, or parsing crash reports, working with tabular data on GitHub just got a little bit easier.
For more information, check out our help article.
Happy Analyzing!
Written by

Related posts

10 technical talks I’m excited about at GitHub Universe 2026
From verifying AI-written code to securing npm dependencies, these are the sessions I’m building my Universe agenda around.

Developer policy update: Transparency, state policy, and what’s ahead
Explore GitHub’s latest transparency data and learn more about policy updates affecting developers and open source.

Developers want more efficient software. Here’s what over 1,000 GitHub users told us they need.
New research from GitHub and Yale Program on Climate Change Communication finds strong demand for tools, measurement, and practical guidance that can help developers reduce wasted compute.