Introducing GitHub Traffic Analytics
The holidays are over and we’re getting back into the shipping spirit at GitHub. We want to kick off 2014 with a bang, so today we’re happy to launch Traffic…
The holidays are over and we’re getting back into the shipping spirit at GitHub.
We want to kick off 2014 with a bang, so today we’re happy to launch Traffic analytics!
You can now see detailed analytics data for repositories that you’re an owner of or that you can push to. Just
load up the graphs page for your particular repository and you’ll see a new link to
the traffic page.
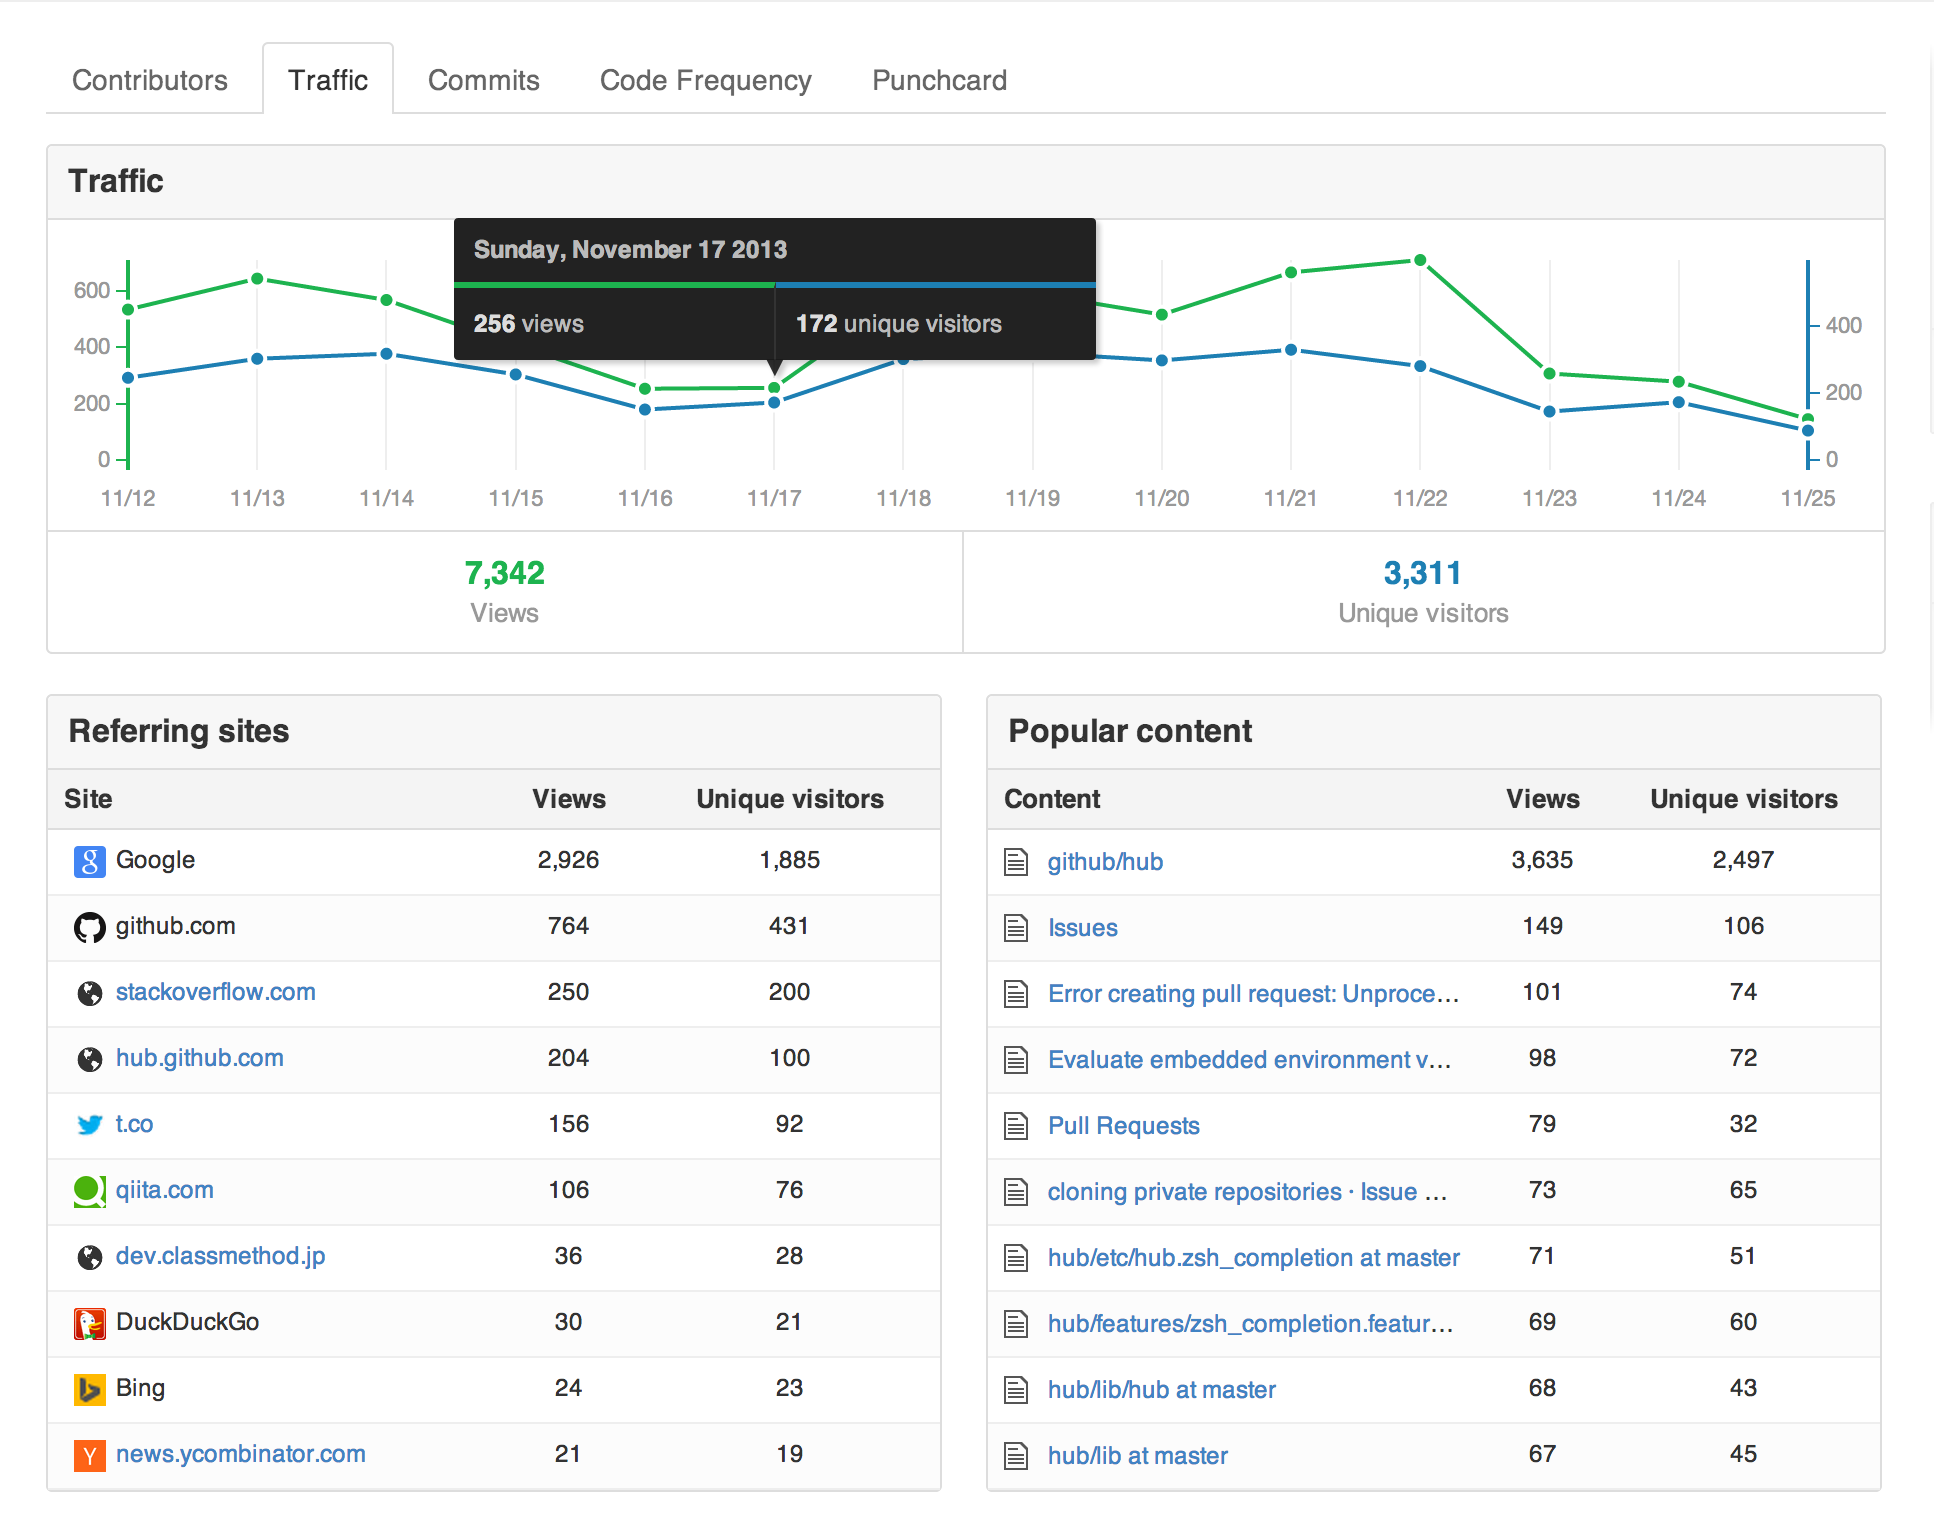
When you land on the traffic page you’ll see a lot of useful information about your
repositories including where people are coming from and what they’re viewing.
Looking at these numbers for our own repositories has been fun, sometimes surprising, and always interesting.
We hope you enjoy it as much as we have!
Written by

Related posts
Developer policy update: Intermediary liability, copyright, and transparency
We’re sharing recent policy updates that developers should know about, updating our Transparency Center with the full year of 2025 data, and looking to what’s ahead.

GitHub availability report: March 2026
In March, we experienced four incidents that resulted in degraded performance across GitHub services.

GitHub Universe is back: We want you to take the stage
Get inspired by five of the most memorable, magical, and quirky Universe sessions to date.