Clone Graphs
Our traffic graphs tab shows you a lot of information about who’s visiting your repository on the web. We’ve added a new graph to this tab, showing git clone activity.…
Our traffic graphs tab shows you a lot of information about who’s visiting your repository on the web. We’ve added a new graph to this tab, showing git clone activity.
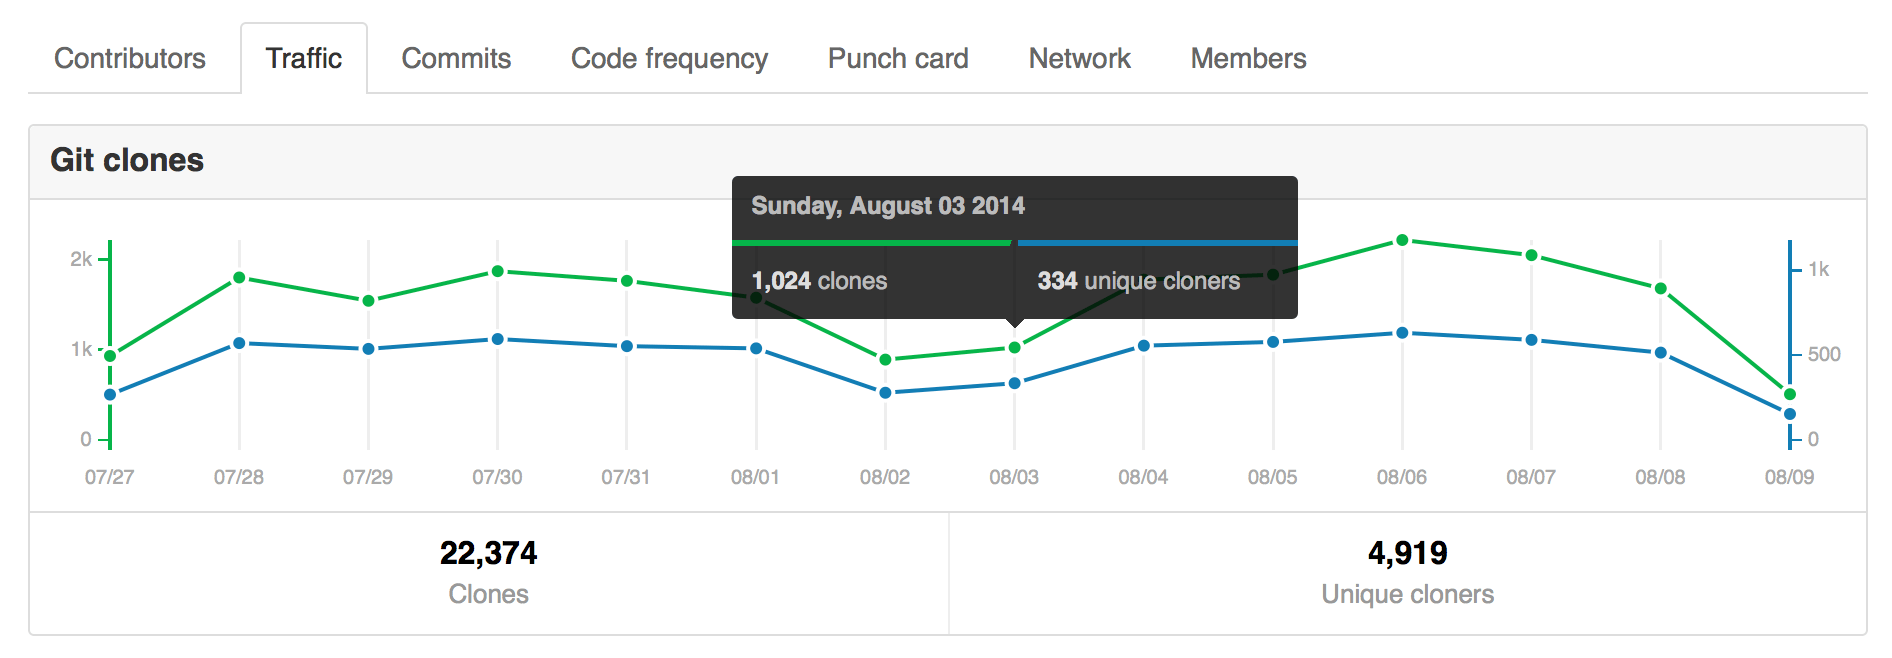
You can use it to find out how many times your repository’s source code is actually cloned in a given day, as well as how many unique GitHub users (or anonymous IP addresses) did the cloning.
For more information on traffic graphs, check out the documentation.
Written by

Related posts

GitHub availability report: June 2026
In June, we experienced six incidents that resulted in degraded performance across GitHub services.

Q1 2026 Innovation Graph update: Open source collaboration is accelerating worldwide
New Innovation Graph data shows global developer communities growing faster than ever, with collaboration reaching new highs across many economies.
GitHub joins coalition advocating for fixes to California AI Transparency Act to protect open source
We’re calling for targeted amendments to resolve conflicts with open source licensing and align with international transparency frameworks while preserving regulatory intent.