Data Challenge II Results
In April we announced the second annual GitHub data challenge. Since last year, GitHub’s public timeline data on Google BigQuery has grown by over 80 million events, including 3.8 million…
In April we announced the second annual GitHub data challenge.
Since last year, GitHub’s public timeline data on
Google BigQuery has grown by over 80 million events, including
3.8 million new repositories, 38 million pushes, and 8 million comments on issues, pull requests, and commits.
After receiving some amazing entries in the previous
challenge, we were excited to see what people would discover with another year of data. The results blew us away:
we saw many more entrants and novel applications of our data. GitHubbers ranked their favorite entries, and after
tallying the votes, we’re happy to announce the top 3 entries for the 2013 GitHub data challenge.
First Place
The Open Source Report Card, by Dan Foreman-Mackey, analyzes a GitHub
user’s contributions to produce a “report card” with statistics and automatically generated prose.

Second Place
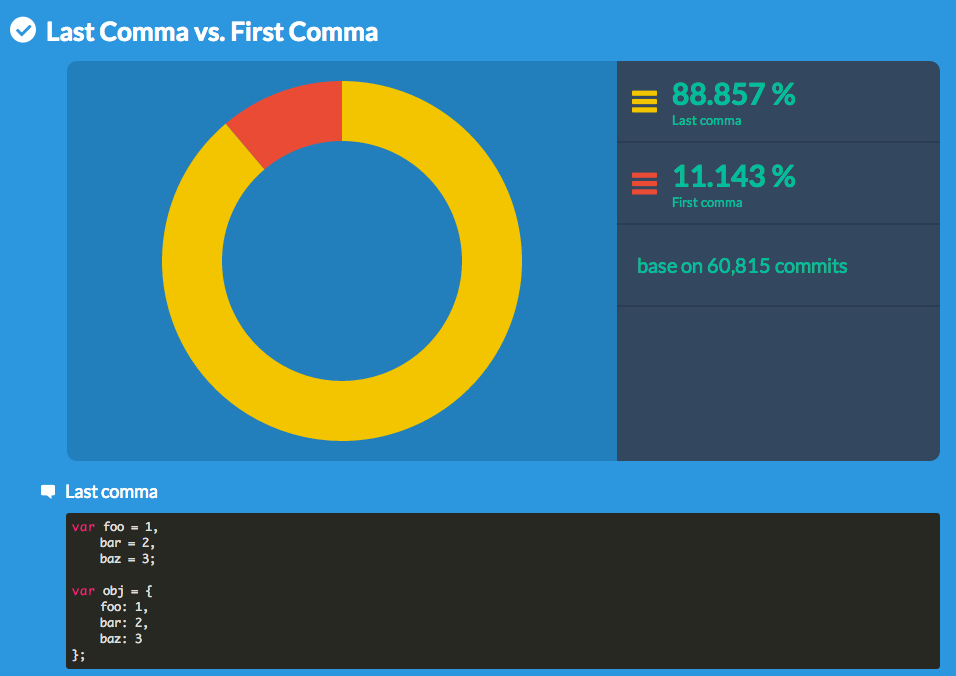
How often do people use tabs over spaces in Java? How many commits have lines wrapped to 80 characters?
Popular Convention by Outsider
uses GitHub data to analyze conventions in selected programming languages.
Third Place
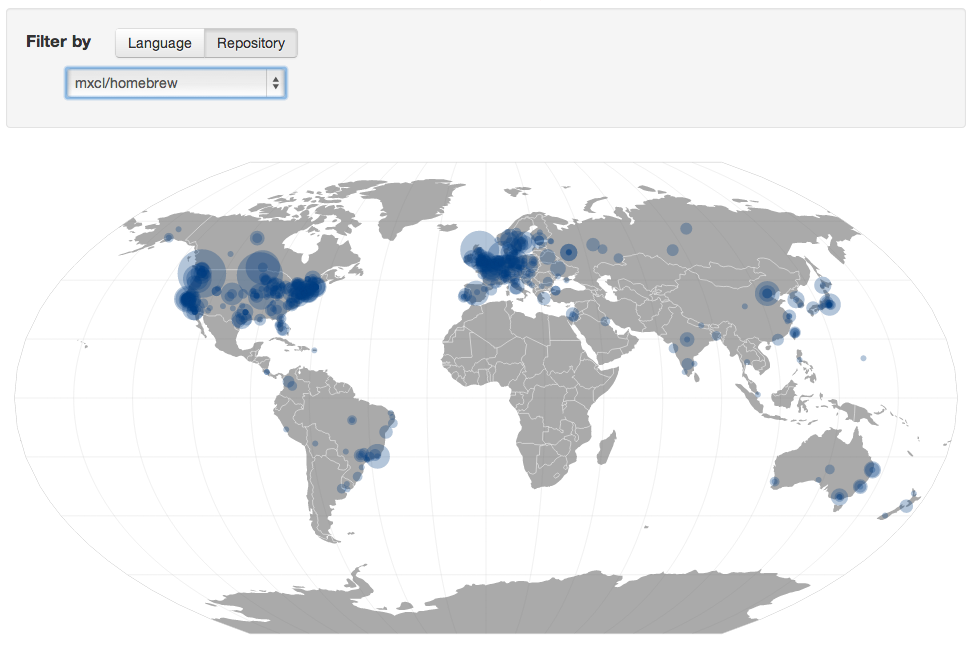
David Fischer’s visualization of
open source contributions by location shows the geographic
distribution of contributors behind the 200 most active GitHub repositories.
Thanks
Congratulations to the winning entries, and huge thanks to everyone who submitted an entry!
Our top
3 winners will receive gift certificates to the GitHub Shop for $200, $100, and $50,
respectively.
We can’t wait to see what the next data challenge will bring!
Written by

Related posts

What’s coming to our GitHub Actions 2026 security roadmap
A look at GitHub Actions’ 2026 roadmap, outlining how secure defaults, policy controls, and CI/CD observability harden the software supply chain end to end.
Updates to GitHub Copilot interaction data usage policy
From April 24 onward, interaction data—specifically inputs, outputs, code snippets, and associated context—from Copilot Free, Pro, and Pro+ users will be used to train and improve our AI models unless they opt out.

GitHub availability report: February 2026
In February, we experienced six incidents that resulted in degraded performance across GitHub services.