Benchmarking GitHub Enterprise
The release of GitHub Enterprise 2.0 brought more than just new features and support for deployment on Amazon Web Services. It also included a rework of our virtual machine architecture…
The release of GitHub Enterprise 2.0 brought more than just new features and support for deployment on Amazon Web Services. It also included a rework of our virtual machine architecture to improve performance and reliability. In making these changes, we used straightforward benchmarking each step of the way. With this data and our trusty set of Unix tools, we were able to discover, debug, and eventually solve several interesting performance issues for our Enterprise customers.
Writing benchmarks
We considered a few benchmarking solutions to test the performance of the all-important git clone operation. In the end, we opted for a simple yet effective solution: a script that could run a series of simultaneous git clone commands against an Enterprise server.
This approach gave us a good starting point to see how Enterprise might perform under very heavy use.
Baseline performance
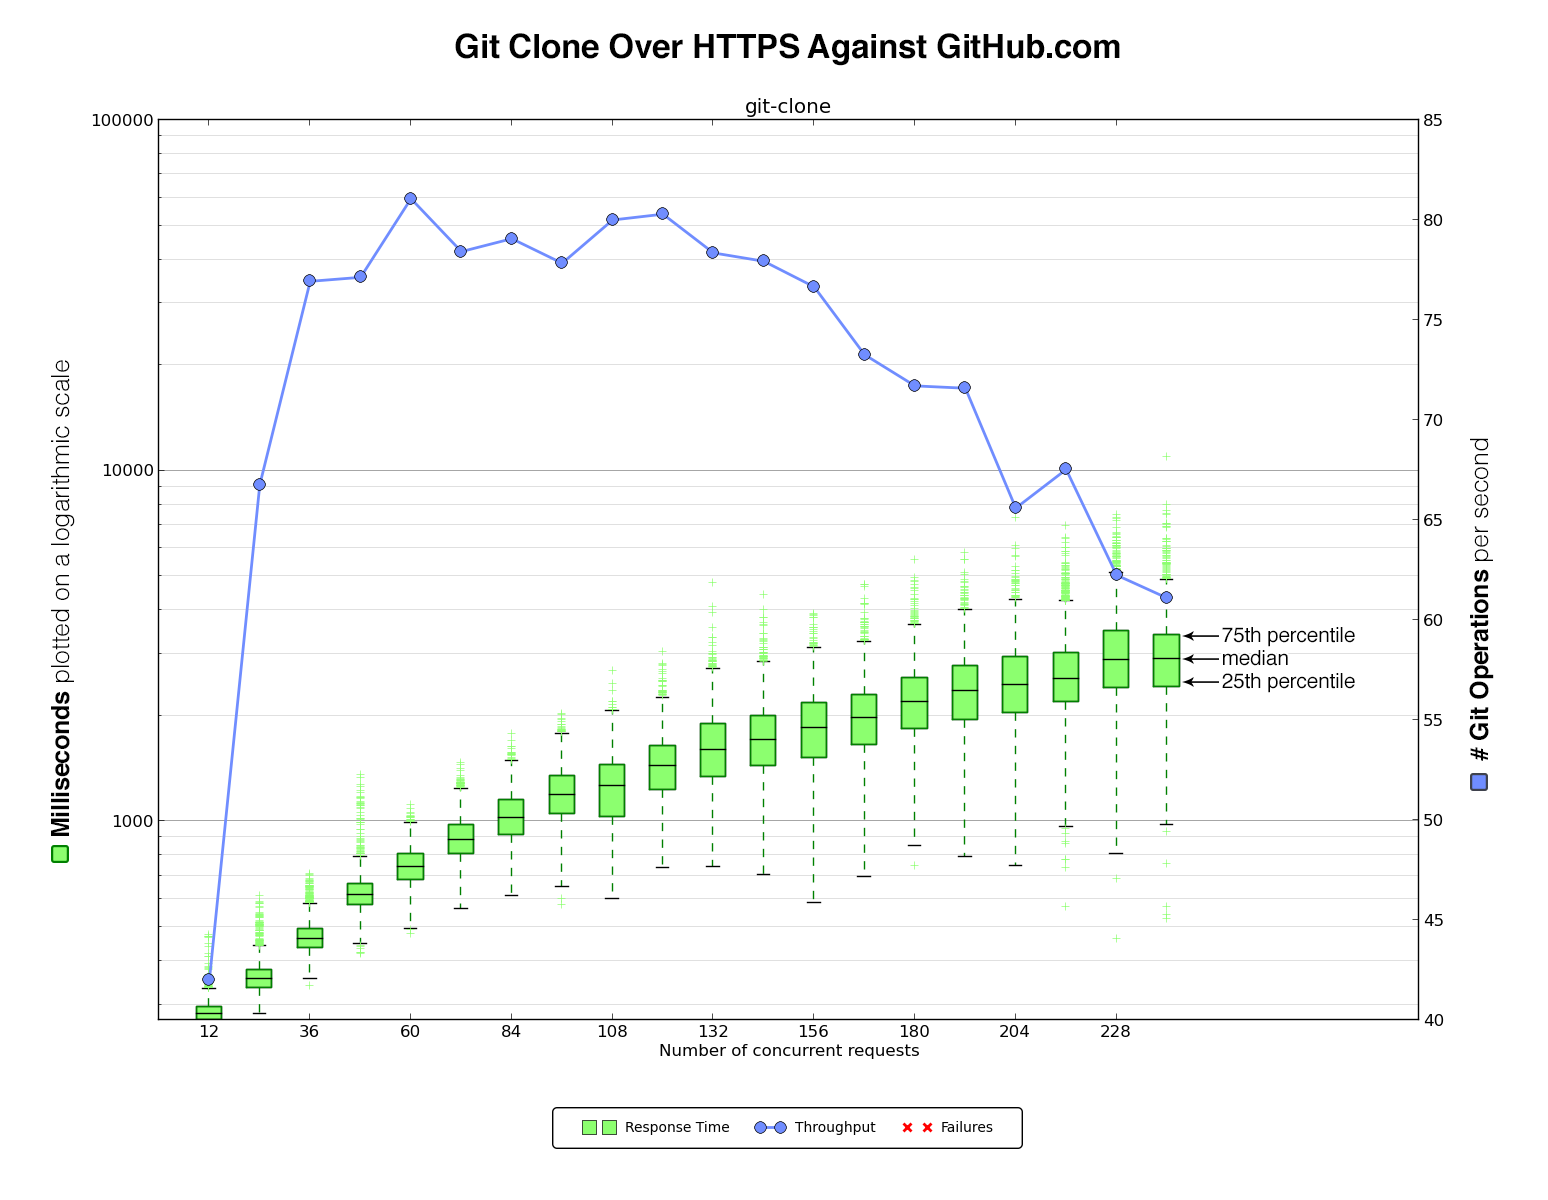
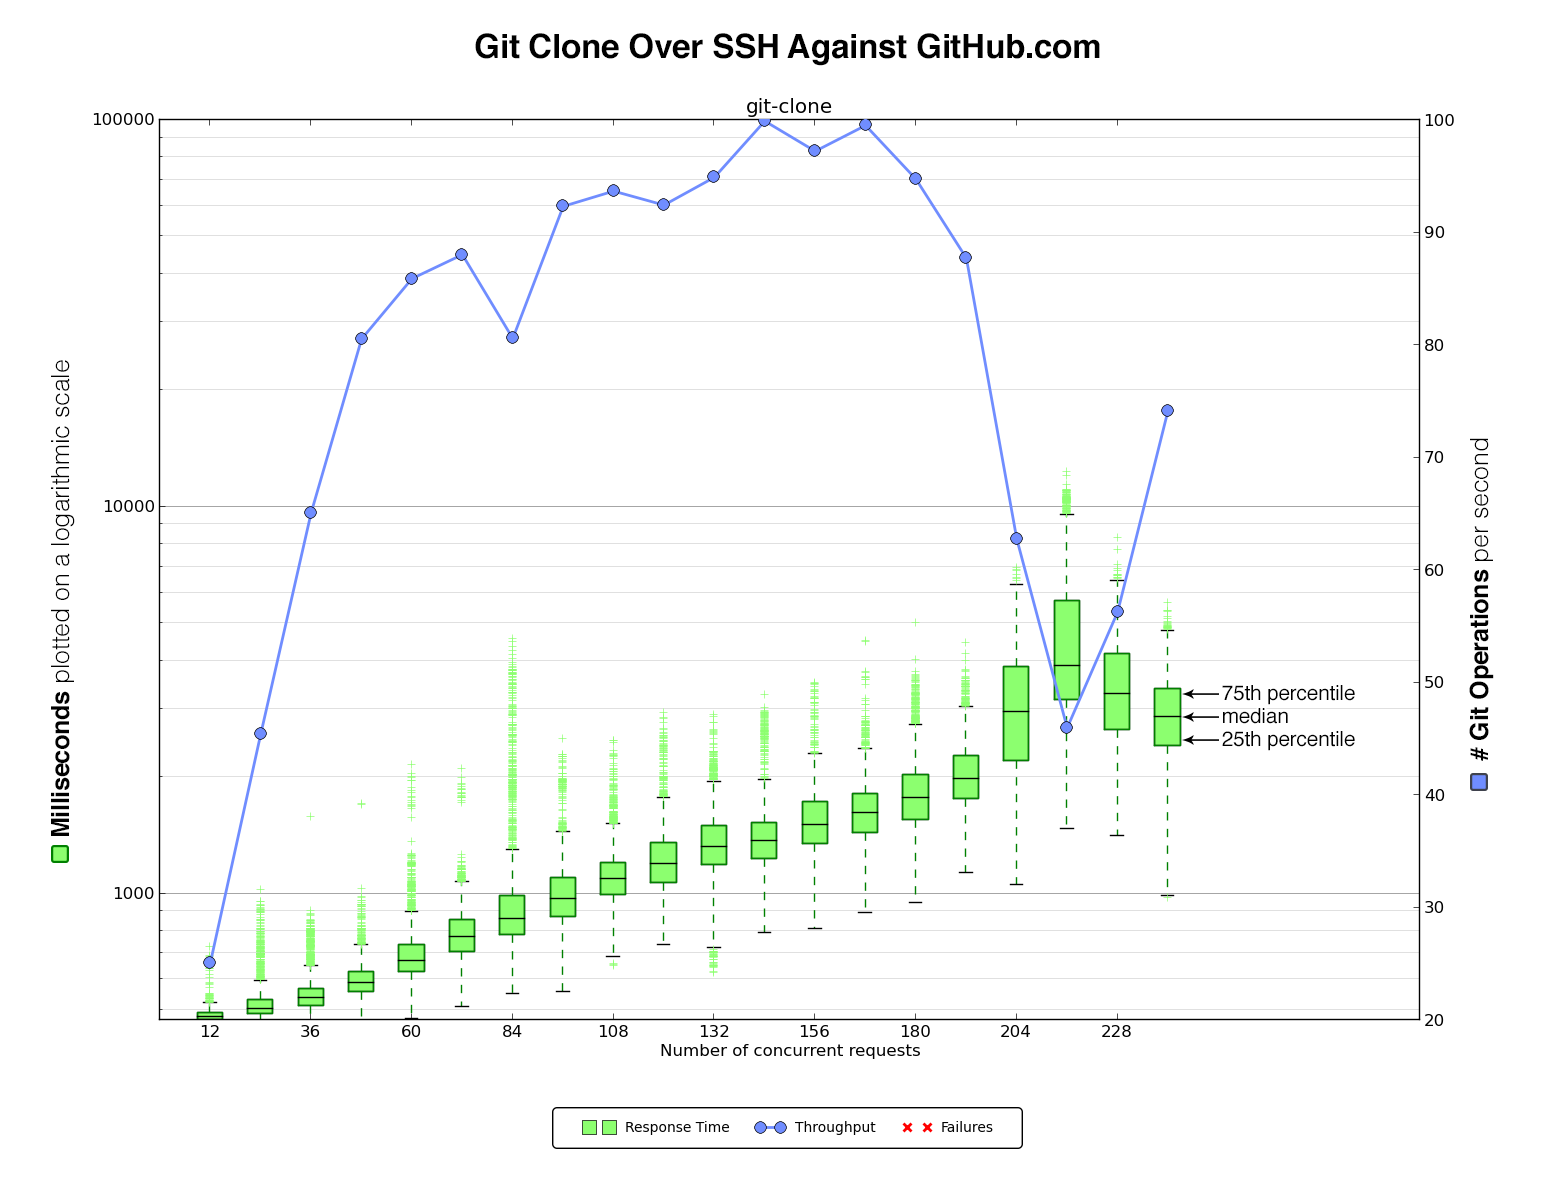
We ran our script against GitHub.com first to get some initial numbers to compare against the Enterprise virtual machine.
The benchmark script cloned data over HTTPS or SSH and against the github/gitignore repository. We picked this repository because it is pretty small yet still has some realistic activity. In the benchmark we ramped up the number of concurrent clones over time in order to see how the VM handled heavier and heavier load. This also served as a way to determine the amount of load the benchmark script itself could generate running from a single client.
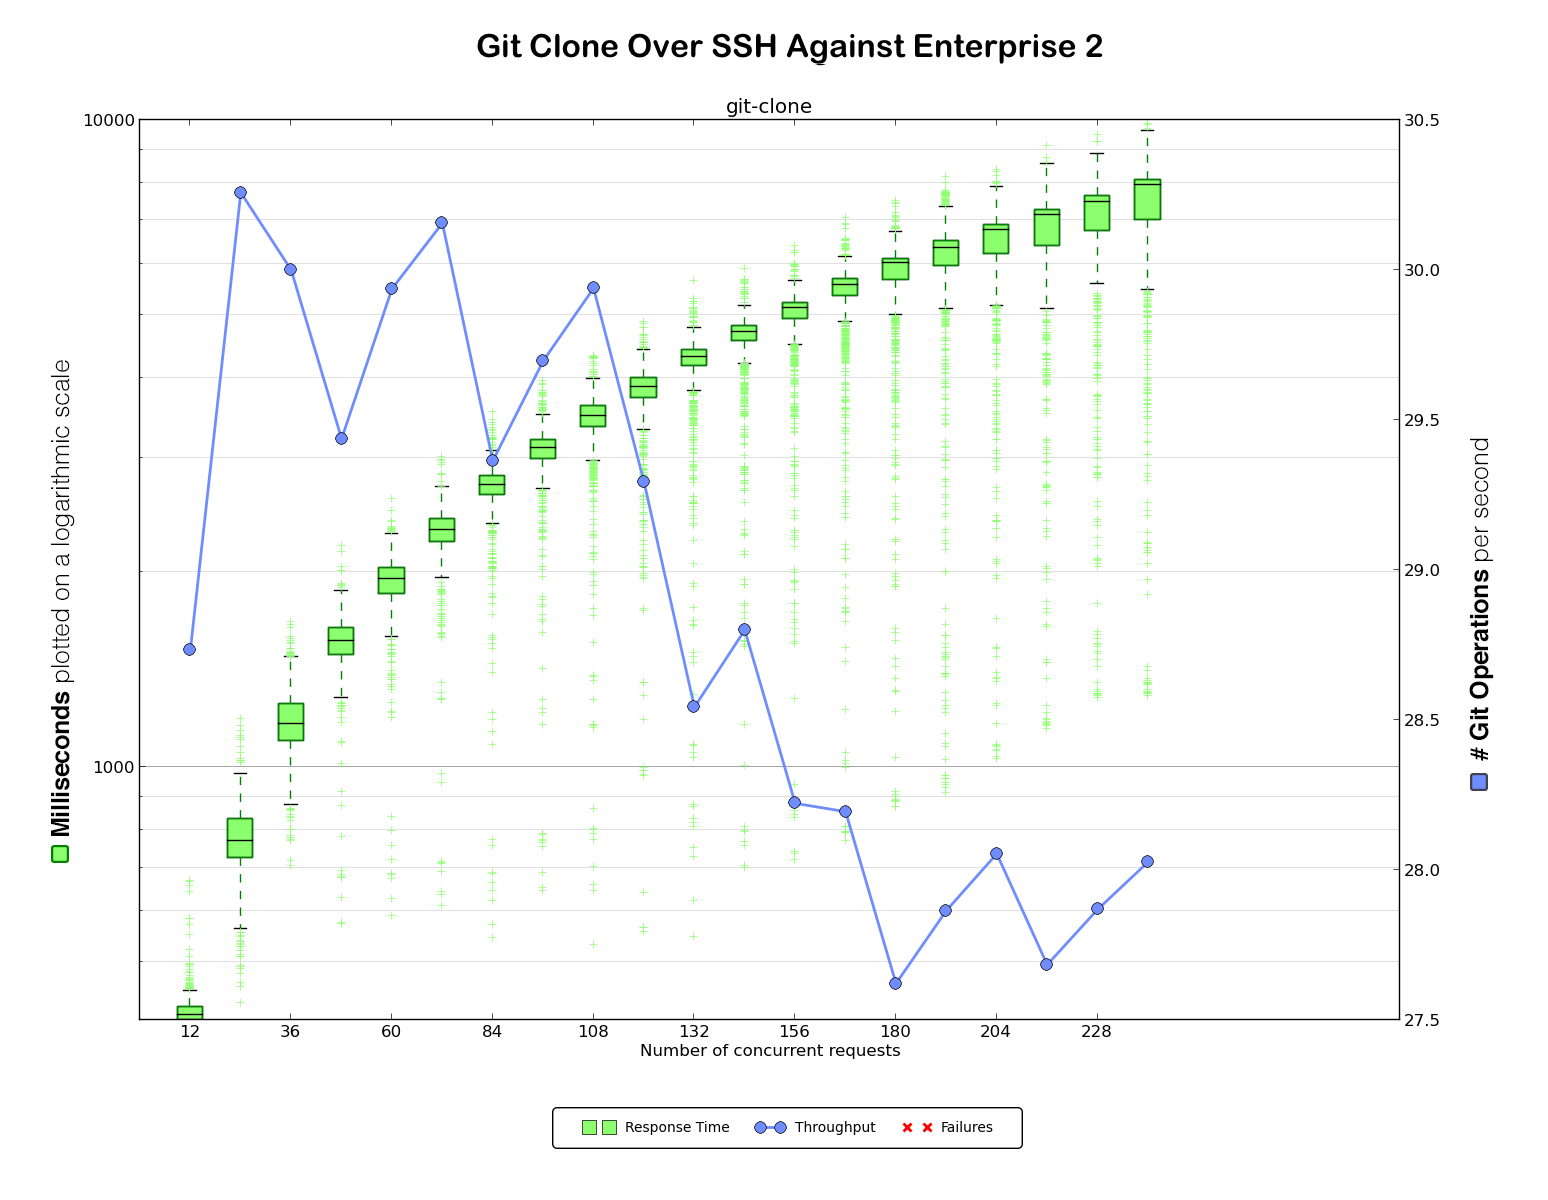
After each clone, our script would output a timestamp with the start time, duration of the operation, and exit status of the clone. This was then graphed with matplotlib to generate a graph like this:
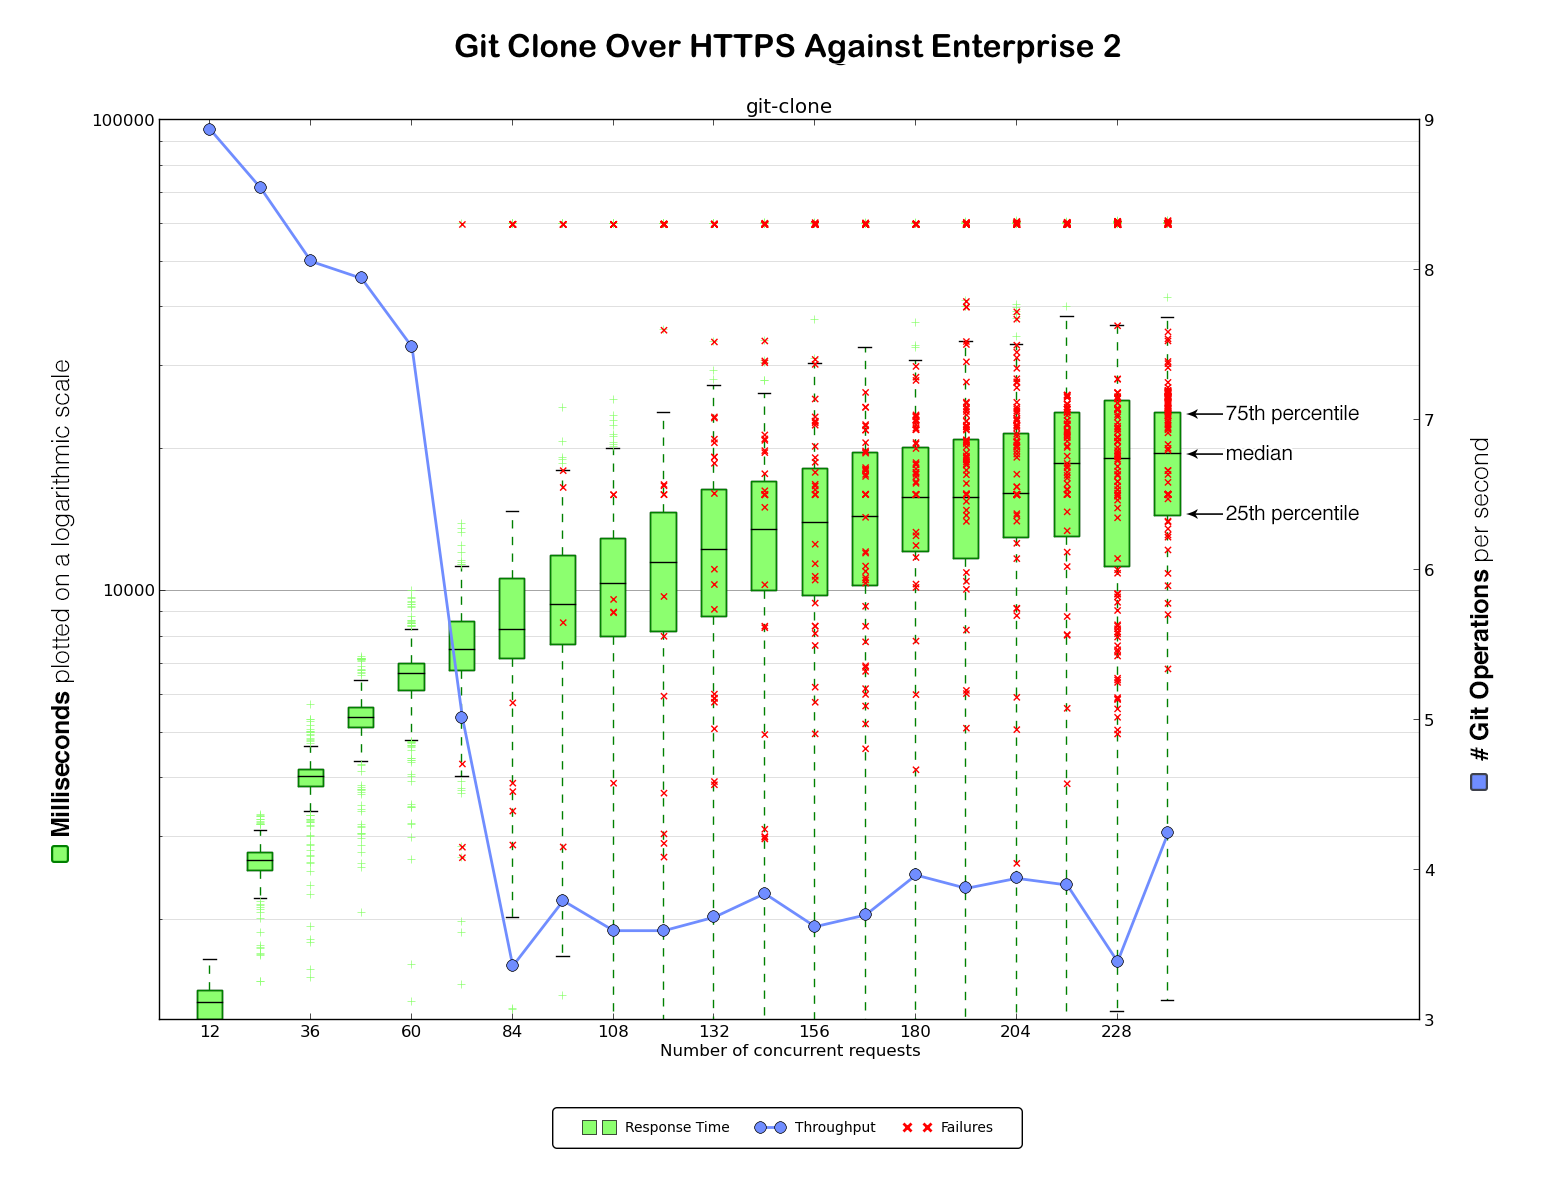
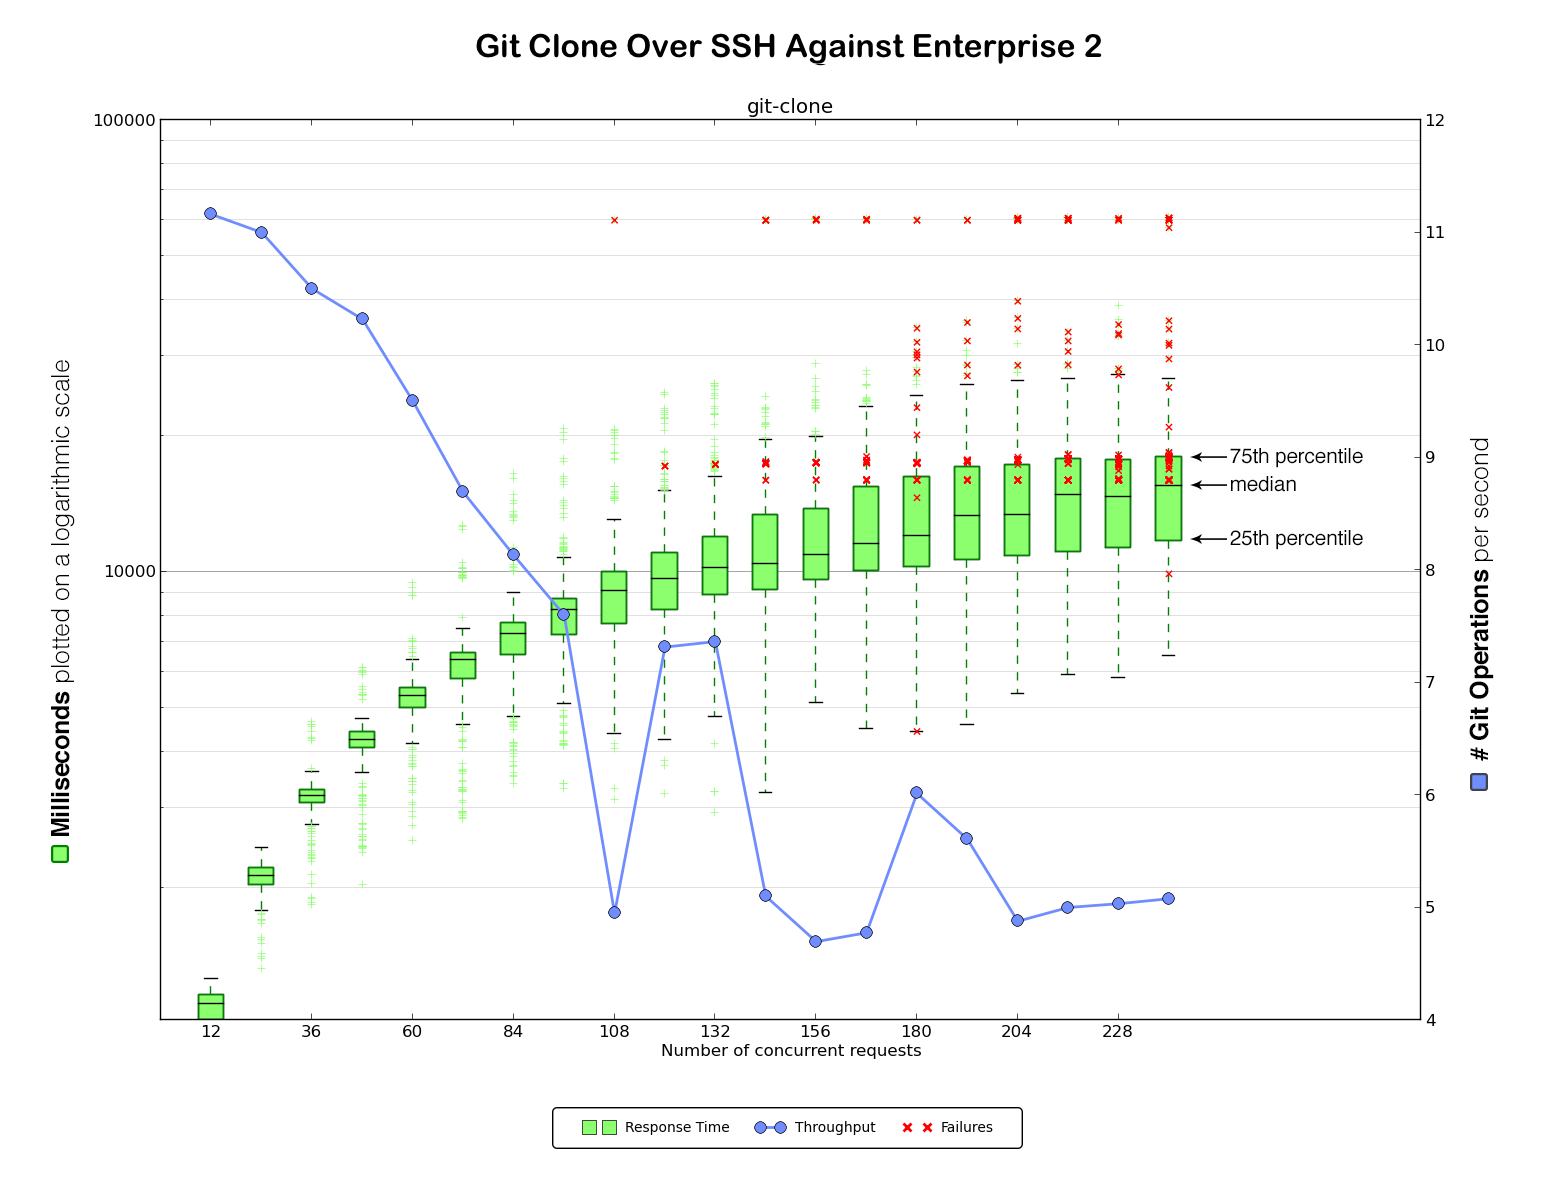
On the left are the clone times in milliseconds, plotted on a logarithmic scale. The green boxplot and green marks show the collected samples of clone times.The line inside the green box indicates the median. The top of the box represents the 75th percentile, while the bottom line of the box represents the 25th. The “whiskers” indicate the interquartile range. Measurements outside that range are plotted separately.
On the right it shows the number of git operations handled per second. This number is identified by the blue line in the graph. Any error in a benchmarking run is indicated as a red cross in the graph.
Enterprise 11.10.x
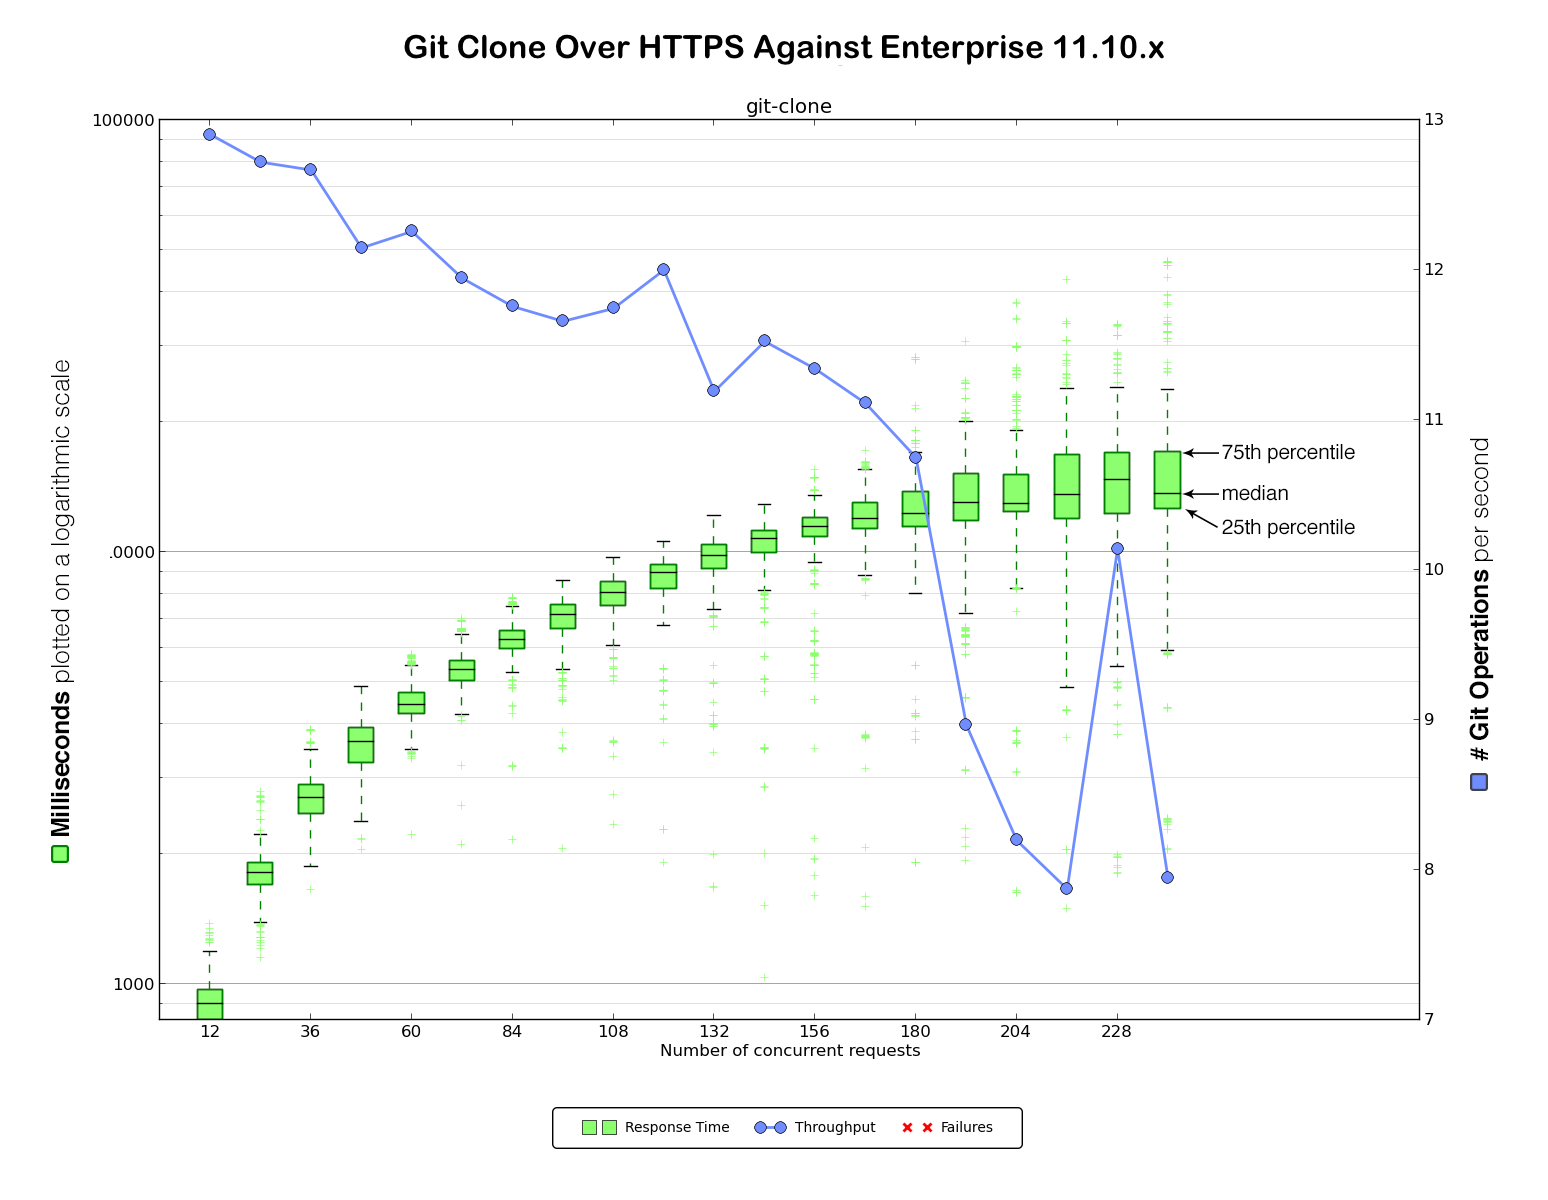
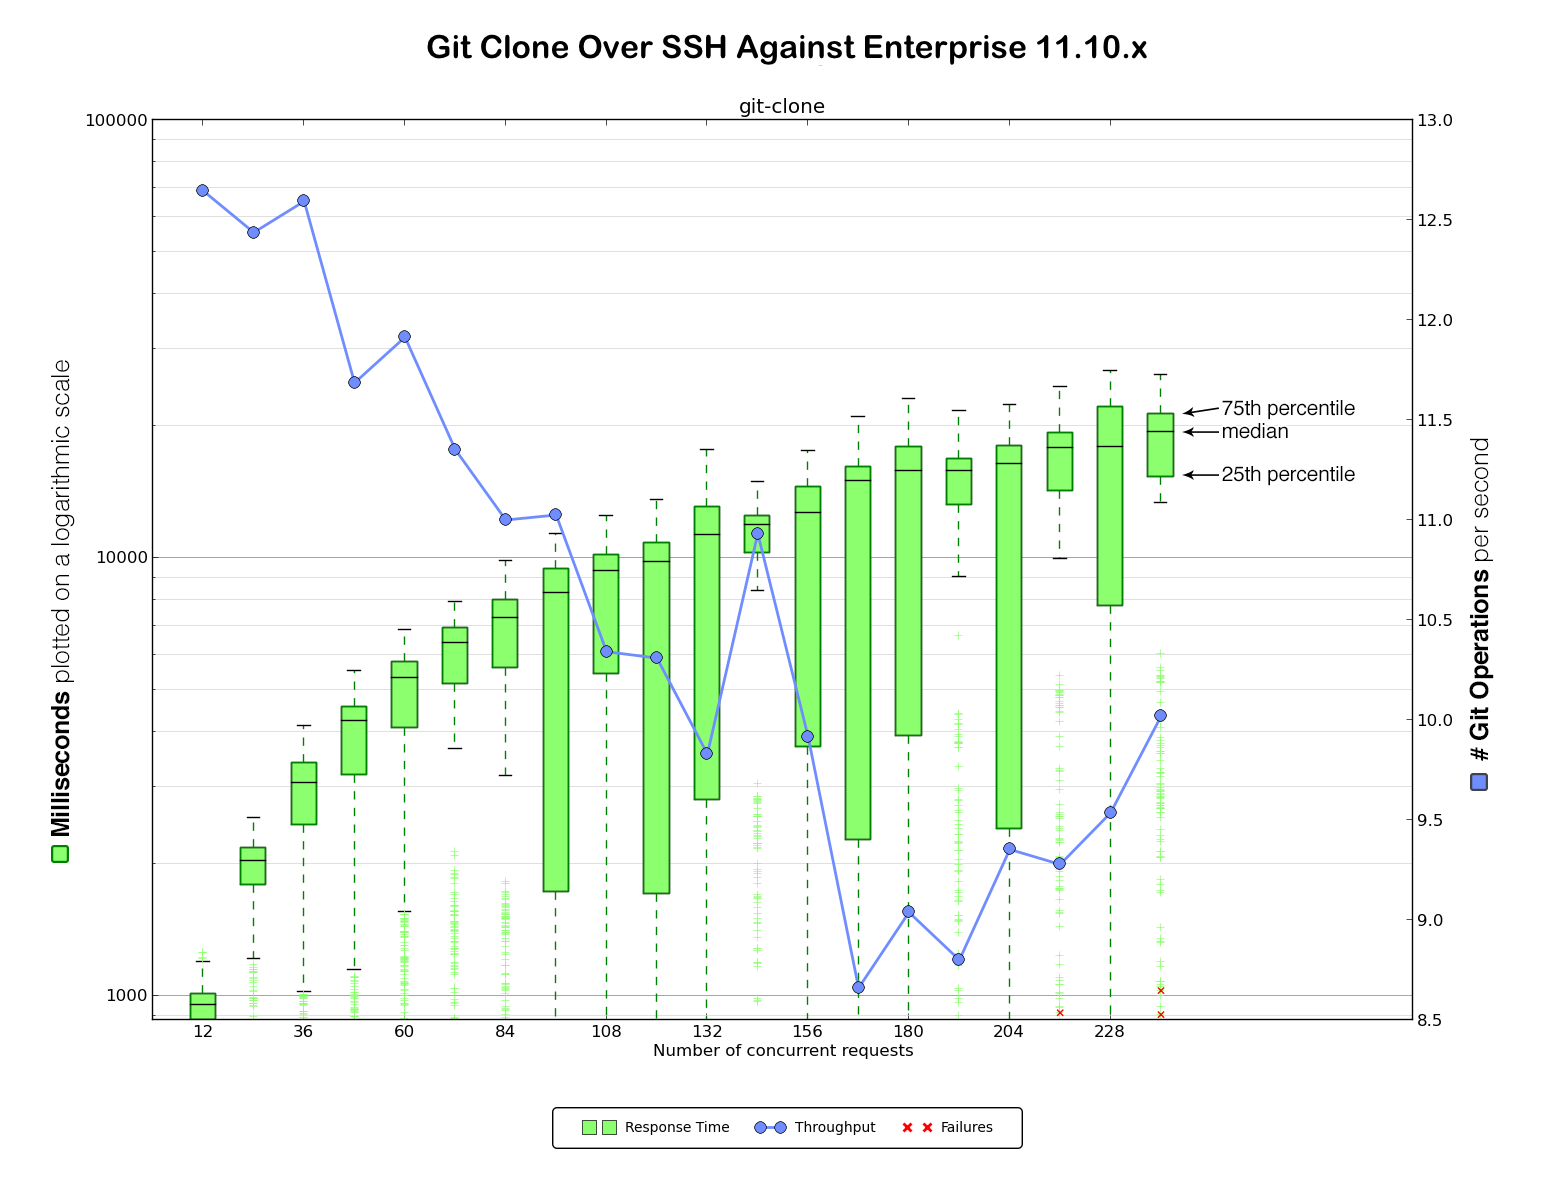
Benchmarking against GitHub.com provided a baseline to determine how much load our client could generate. Now it was time to gather data against our existing Enterprise 11.10.x VM. We considered this the very minimum baseline performance we would need to maintain in any upgrade (although, of course, our intention was significant improvement over the 11.10.x VM).
For this straightforward benchmarking exercise we set up two identical machines for each Enterprise version. Here is the data for HTTPS and SSH clones against Enterprise 11.10.x:
Enterprise 2
It was now time for our very first benchmark against Enterprise 2 (again, HTTPS first and then SSH).
Not good at all! Very high error rates and slow performance.
We hypothesized that the performance problems were largely attributable to those errors, as we observed a significant number of requests timing out after one minute without ever successfully completing. It was time to dig in and see what was going on.
Initial performance improvements
We logged into the Enterprise 2 test instance, fired up strace and immediately
discovered many Ruby processes loaded on each clone as part of our post-receive hooks. @simonsj recognized that on GitHub.com we were already using a faster hook setup, so we ported that over to Enterprise 2. Although this change helped remove a lot of performance overhead, we were still seeing plenty of errors. Time for more digging.
Error logs
We went looking through the log files for the components involved in this clone path. On GitHub.com and now on Enterprise 2 (but not on Enterprise 11.10.x) we run an internal C daemon called babeld to route and serve all our Git traffic across different protocols. So we figured the logs for babeld and HAProxy (which sits in front of babeld) were a good starting point:
Thu Sep 18 00:50:59 2014 pid=6712 tid=18817 version=e594222 proto=http http_url=/ghe-admin/gitignore.git/git-upload-pack ip=172.16.9.25 user=ghe-admin repo=ghe-admin/gitignore cmd=git-upload-pack duration_ms=15819.033771 fs_bytes_sent=0 fs_bytes_received=0 bytes_from_client=708 bytes_to_client=0 log_level=ERROR msg="http op done: (-1) localhost" code=-1
Thu Sep 18 00:52:16 2014 pid=6712 tid=27175 version=e594222 proto=http http_url=/ghe-admin/gitignore.git/info/refs?service=git-upload-pack ip=172.16.9.25 user=ghe-admin repo=ghe-admin/gitignore duration_ms=15803.741230 fs_bytes_sent=0 fs_bytes_received=0 bytes_from_client=434 bytes_to_client=0 log_level=ERROR msg="http op done: (-1) localhost" code=-1
Thu Sep 18 00:52:18 2014 pid=6712 tid=27699 version=e594222 proto=http http_url=/ghe-admin/gitignore.git/info/refs?service=git-upload-pack ip=172.16.9.25 user=ghe-admin repo=ghe-admin/gitignore duration_ms=15801.913778 fs_bytes_sent=0 fs_bytes_received=0 bytes_from_client=434 bytes_to_client=0 log_level=ERROR msg="http op done: (-1) localhost" code=-1
The log_level attribute in these log lines indicates the type of problem. ERROR indicates a problem, the msg attribute shows the actual error. Normally it shows the HTTP status that is returned, but a status of -1 indicates it is not even able to receive a response from upstream. The HTTP call here is hitting a service called gitauth (which determines the access levels the user has for a Git operation). Perhaps our benchmark was exhausting gitauth in such a way it wasn’t able to reply quickly to our authentication requests.
babeld has an internal queue length set for how many outstanding requests it will send along to gitauth. This limit was set to 16, based on how many gitauth workers we were running on GitHub.com at this time. On Enterprise 2, however, we only have two to four of these workers, so a pending queue of 16 was able to overload this backend. @simonsj opened a pull request that allowed us to configure the gitauth settings as necessary.
We solved the problem during the authentication phase, but we still saw Git clients hang. This meant we had to look at the next step in the process where babeld connects to git-daemon to run the actual Git command. We noticed timeouts connecting to git-daemon, indicating that the daemon was not accepting connections. This problem manifested itself in our testing as Git clients hanging indefinitely. And so the debugging continued.
Firewall configuration
Next we looked at dmesg on the test machine. We saw entries like this in the log there, triggered by the firewall:
[Fri Sep 12 17:37:24 2014] [UFW BLOCK] IN=eth0 OUT=
MAC=00:0c:29:f8:e4:b8:00:1c:73:4a:03:21:08:00 SRC=172.16.9.25
DST=172.16.20.244 LEN=40 TOS=0x00 PREC=0x00 TTL=60 ID=10484 DF PROTO=TCP
`SPT=59066 DPT=443 WINDOW=0 RES=0x00 RST URGP=0
[Fri Sep 12 17:37:24 2014] [UFW BLOCK] IN=eth0 OUT=
MAC=00:0c:29:f8:e4:b8:00:1c:73:4a:03:21:08:00 SRC=172.16.9.25
DST=172.16.20.244 LEN=40 TOS=0x00 PREC=0x00 TTL=60 ID=10485 DF PROTO=TCP
SPT=59066 DPT=443 WINDOW=0 RES=0x00 RST URGP=0
These appeared to be blocking port resets being sent back to the clients, which could plausibly explain why they were hanging. So we fixed the firewall issue, but yet that still didn’t seem to solve all the client hangs.
Tcpdump debugging
Next up was tcpdump, a classic Unix tool which we often use at GitHub to debug network problems.
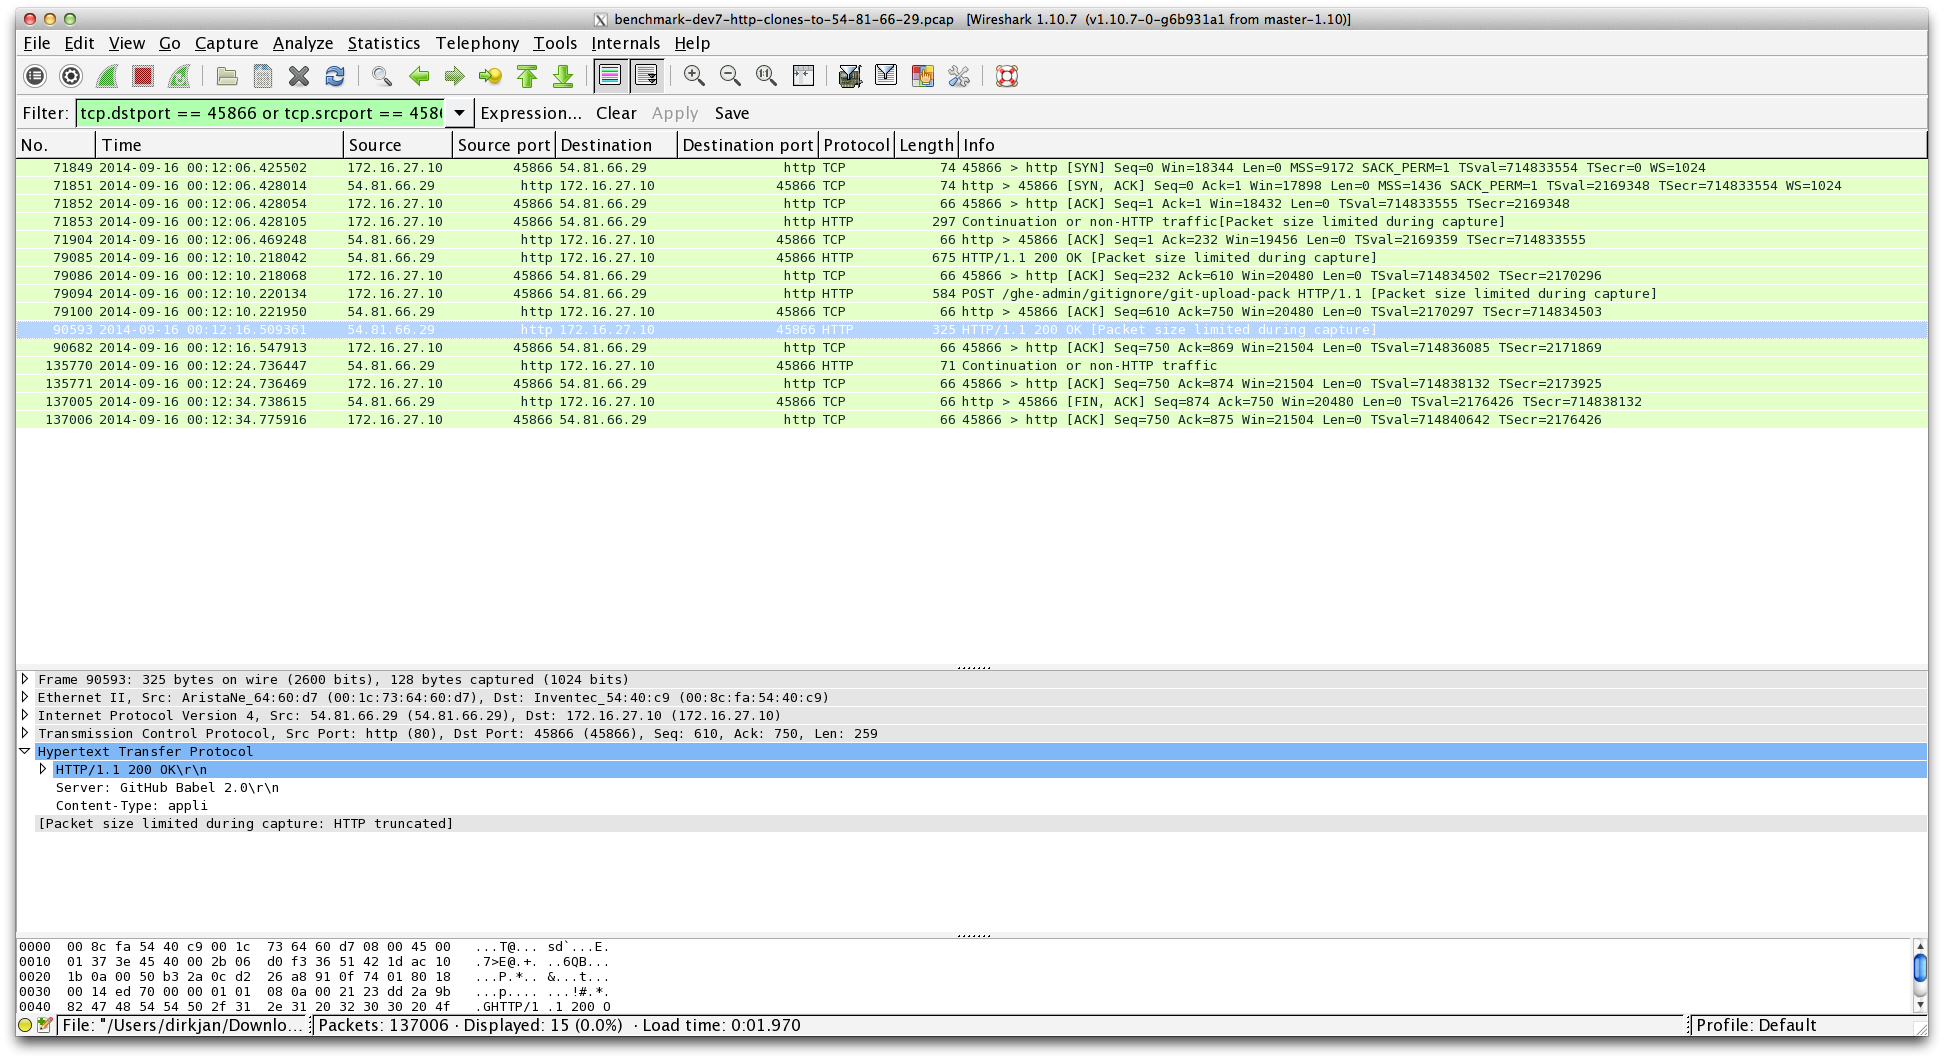
This screenshot from Wireshark shows that although we are sending an HTTP/1.1 200 OK response, we never actually send any data packets, and a Git client will hang without data that it can properly deserialize.
SYN packets and listen backlogs
We realized that we had missed an important clue back in that dmesg output. From time to time we would see this entry:
[ 1200.354738] TCP: Possible SYN flooding on port 9000. Sending cookies.
Check SNMP counters.
Port 9000 is where git-daemon runs, which matched our guess that git-daemon was a factor here. More Unix tools were in order and we looked at the output of netstat -s to see if we could glean more information. And netstat did indeed show us two very useful messages:
    10421 times the listen queue of a socket overflowed
    10421 SYNs to LISTEN sockets dropped
Aha! This indicated that we might not actually be accepting connections for git-daemon here, which could very well result in those weird errors and hangs all the way back in the client.
At this point @scottjg remembered a pull request he wrote months ago for a behavior change for git-daemon. The problem there seemed to be similar where babeld wasn’t able to talk to git-daemon. This never turned out to be a real issue in production, but definitely seemed related to what we were seeing here.
To confirm this issue, we took a look at strace to observe the listen call that git-daemon was doing. Our hypothesis was that we had a misconfiguration leading to a very small connection backlog. The output below shows the part where git-daemon sets up its socket to listen to incoming clients.
sudo strace -tt -f git daemon --init-timeout=1
--base-path=/data/repositories --max-connections=0 --port=9000
--listen=127.0.0.1 --reuseaddr --verbose --sys
...
[pid 18762] 19:09:00.706086 socket(PF_INET, SOCK_STREAM, IPPROTO_TCP) =
3
[pid 18762] 19:09:00.706121 setsockopt(3, SOL_SOCKET, SO_REUSEADDR, [1],
4) = 0
[pid 18762] 19:09:00.706152 bind(3, {sa_family=AF_INET,
sin_port=htons(9000), sin_addr=inet_addr("127.0.0.1")}, 16) = 0
[pid 18762] 19:09:00.706189 listen(3, 5) = 0
[pid 18762] 19:09:00.706219 fcntl(3, F_GETFD) = 0
[pid 18762] 19:09:00.706244 fcntl(3, F_SETFD, FD_CLOEXEC) = 0
...
And indeed, the listen(3, 5) syscall means we listen to file descriptor 3, but we only allow for a backlog of 5 connections. With such a small backlog setting, if git-daemon was even slightly loaded, we would drop incoming connections, which resulted in the dropped SYN packets we observed.
Integrating all the fixes
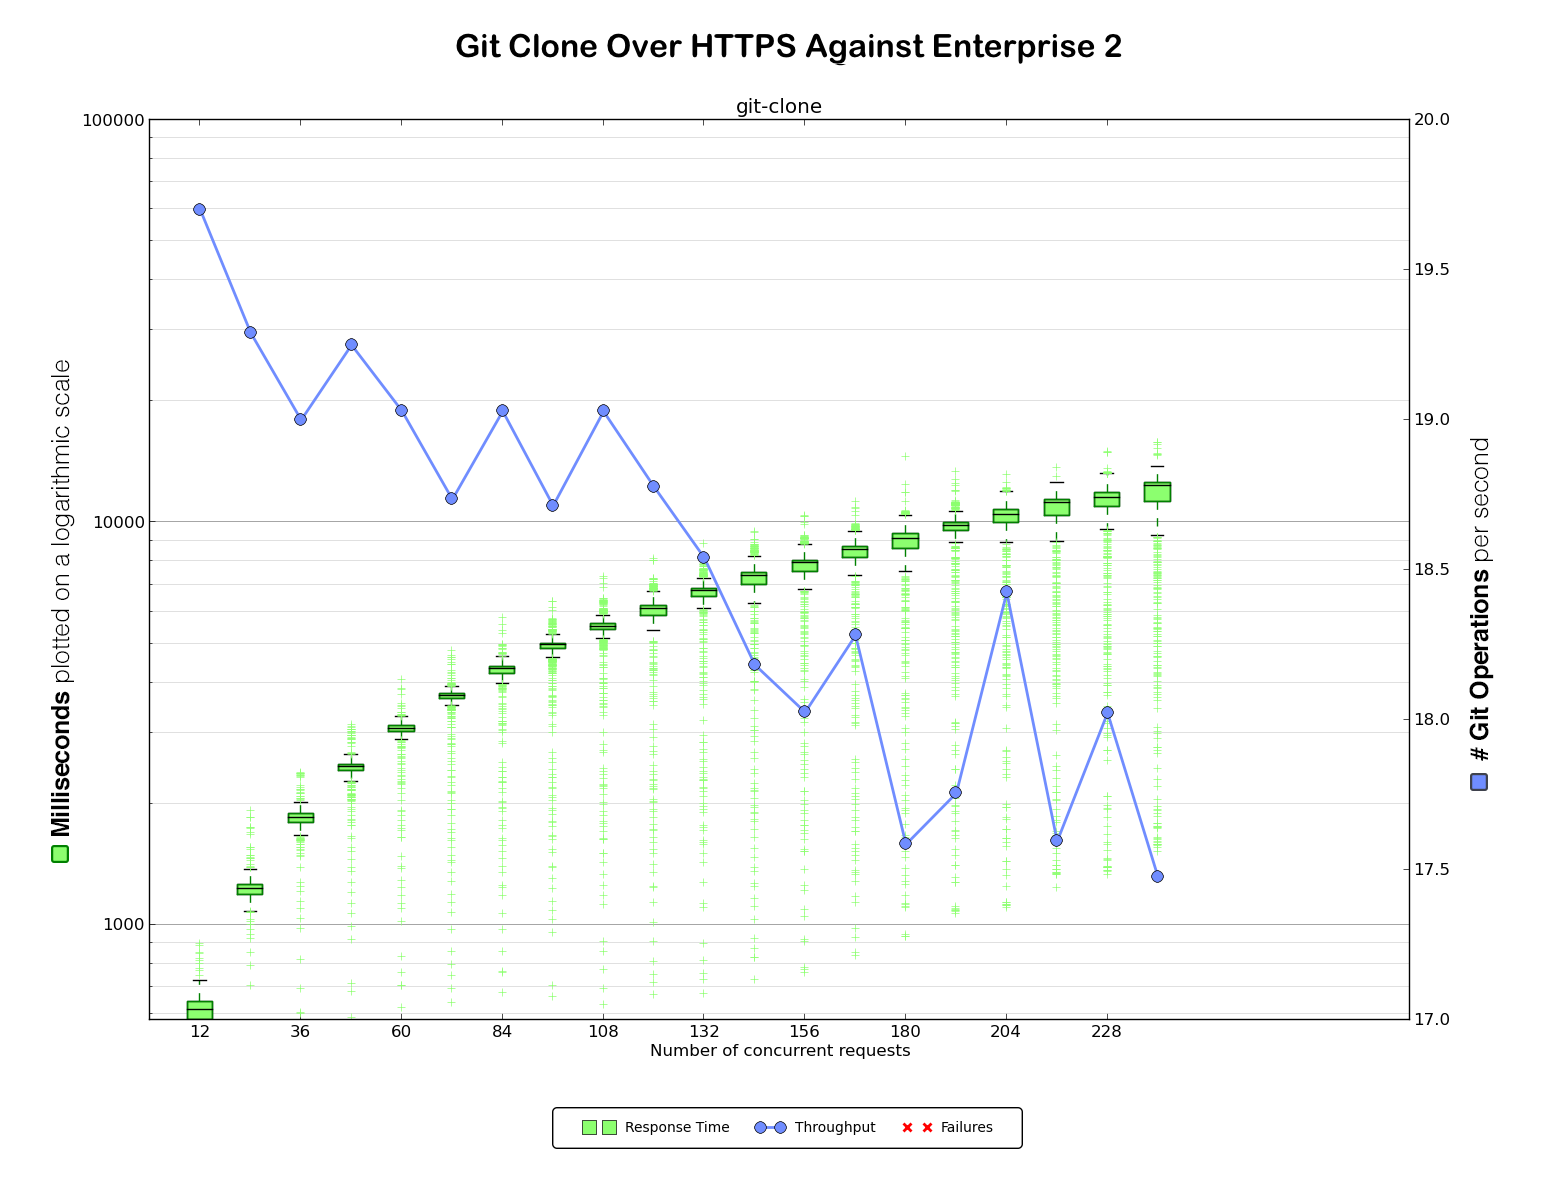
After all that debugging and all those fixes — firewall improvements, hook performance improvement, and of course the git-daemon backlog changes — we ended up with some new benchmark numbers.
Much better. We managed to almost double the throughput for HTTPS and tripled it
for SSH. We also wiped out the errors at the levels of concurrency we benchmarked against.
Lessons learned
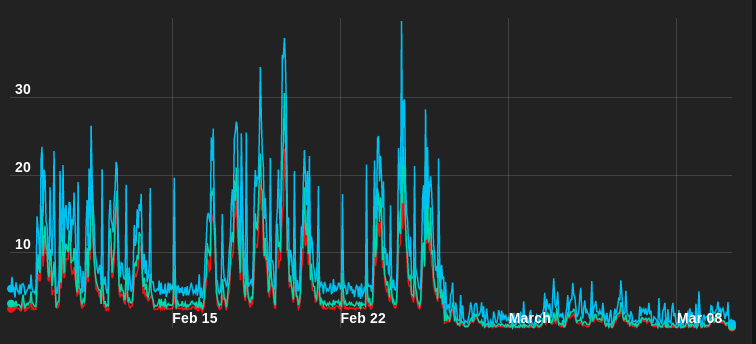
We’re very happy with the results of these benchmarking tests, and of course even happier we were able to successfully debug the issues we saw. Most importantly, our customers have seen great results. Spotify sent us a graph of aggregate system load after upgrading to Enterprise2 on AWS:
Written by
Related posts

An update on GitHub availability
Here’s what we’ve done—and what we’re still doing—to improve our availability and reliability.

GitHub Copilot is moving to usage-based billing
Starting June 1, your Copilot usage will consume GitHub AI Credits.

Changes to GitHub Copilot Individual plans
We’re making these changes to ensure a reliable and predictable experience for existing customers.
