Improving how we deploy GitHub
As GitHub doubled it’s developer head count, tooling that worked for us no longer functioned in the same capacity. We aimed to improve the deployment process for all developers at GitHub and mitigate risk associated with deploying one of the largest developer platforms in the world.

Over the last year GitHub has doubled the number of developers contributing to the main GitHub.com application. While this seems like a solely positive thing on the surface, the 2x increase in folks contributing to the core software exposed some problems in terms of tooling. Tooling that worked for us a year ago no longer functioned in the same capacity. While GitHub itself has been a fantastic vehicle to drive change for GitHub, the deployment tooling and coordination has not enjoyed the same levels of success. One of those areas was our deployments.
GitHub.com is deployed primarily through chatops using a branch deploy model (we deploy branches before merging into the main branch). This meant that developers can add changes to a queue, check the status of the queue, and organize groups of pull requests to be deployed and merged. This all functioned using chatops in Slack in a room called #dotcom-ops. While this is a very simple system it started to cause some confusion while monitoring a deploy as a single chat room managed the queue, the deploy, and many other tasks for many people at the same time. All of a sudden this channel that was once a central part of a crucial information system was overwhelmed by the amount of information being pushed through it. Developers could no longer track their change through the system which resulted in a reduced capacity for that developer and an increased risk profile for GitHub.

This is just one step of about a dozen spread across hundreds of messages, it is hard to keep track and validate the state of a deploy.
The Build
At the beginning of this summer, we set out to be able to completely revamp the way we monitored deploy changes for GitHub.com. With the problem in mind –namely the multi-step, information-dense deploy process via chatops –we set out with a few main goals:
Simplify the Deploy for Developers
One of the main issues that we experienced with the previous system was that deploys were tracked across a number of different messages within the Slack channel. This made it very difficult to piece together the different messages that made-up a single deploy. Sometimes there could be as many as a few hundred messages in between subsequent messages from the deploy system.
Second Canary Stage
The second main issue was that we had a canary stage but the stage would only deploy to up to 2% of GitHub.com traffic. This meant that there were a whole slew of problems that would never get caught in the canary stage before we rolled out to 100% of production, and would have to instead start an incident and roll back. Availability and uptime is of the utmost concern to GitHub, so this risk became crucial to fix and address as GitHub continued to grow. With this in mind, we set out to introduce a second Canary stage at a higher percent so that we could catch more issues in earlier stages which would reduce the impact of future incidents.
At the end of this project, we were able to have two canary stages. The first is at 2% and aims to capture the majority of the issues. This low percentage keeps the risk profile at a tolerable level as such a small amount of traffic would actually be impacted by an issue. A second canary stage was introduced at 20% and allows us to direct to a much larger amount of traffic while still in canary stages. This has a higher risk profile, but is mitigated by the initial 2% canary stage, and allows us to transition with less risk to the 100% production stage.
Automate
The last issue is that developers had to sit with the deploy and help poke it along at every step of the way by running independent chatops commands to queue up, deploy canary, and deploy production – making judgement calls every step of the way. This meant that developers were fumbling with chatops commands multiple times in every deployment, and often getting them wrong.
We asked ourselves “what if there was one command and everything else just happened?”. So we did that, we automated the entire process.
The solution
We already had internal deploy software that was capable of tracking a single part of a deploy. This system had a proven track record and solid foundations, and so we aimed to add the ability to automate the entire deploy sequence from a single chatops command, rather than running multiple commands per deploy, and link these records together within the existing deployment infrastructure. Moreover, this new solution would provide an easy to use interface for a quick overview of any given deployment rather than piecing together multiple chatops commands.
We came up with two basic concepts:
- A deploy is made up of many stages (canary, production, etc.)
- There are gates between different stages that perform some sort of check to validate we can progress to the next stage
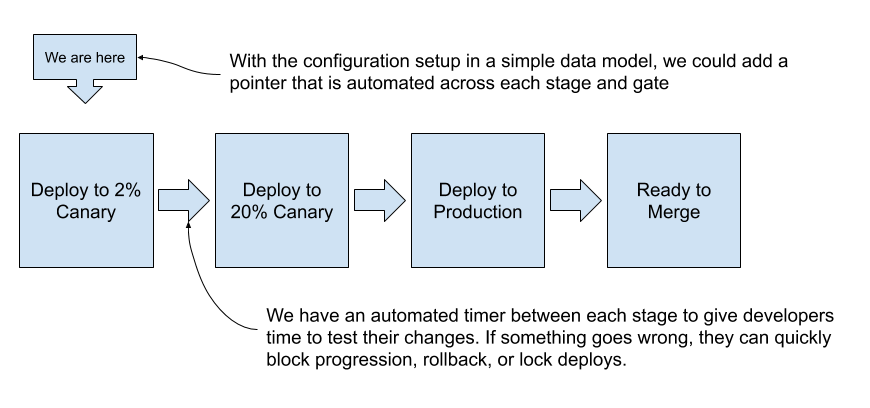
These concepts allowed us to model the entire system in a state-machine-like fashion:

This diagram shows an automatic progression between a 2% canary, 20% canary, production deploy, and a ready to merge stage – separated by automated 5-minute timers. Finally, a pointer was automated to progress across the data model after the timer gates completed and stages were deployed.
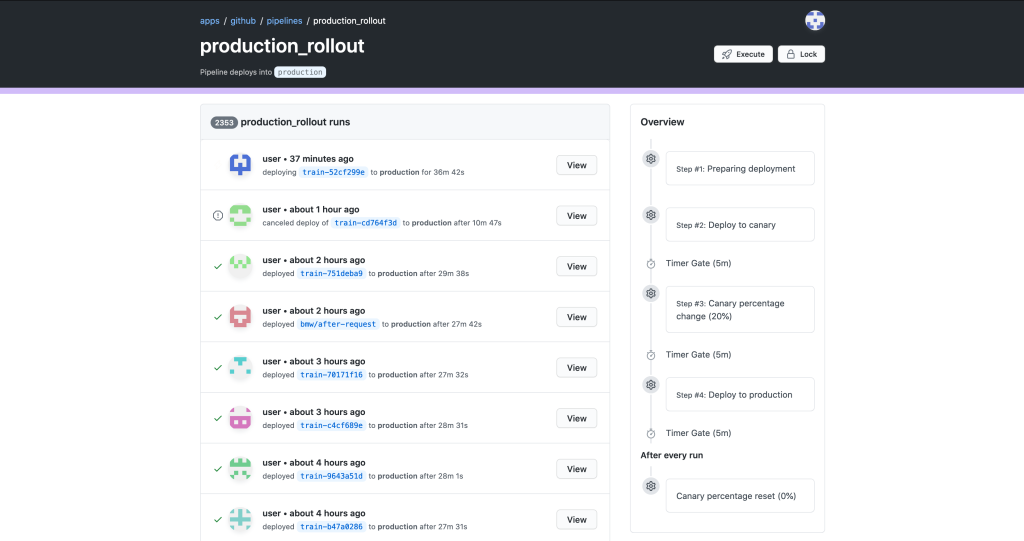
What resulted was a state machine backed deploy system with a first party UI component. This was combined with the traditional chatops with which our developers were already familiar. Below, you can see an overview of deploys which have recently been deployed to GitHub.com. Rather than tracking down various messages in a noisy Slack channel, you can go to a consolidated UI. You can see the state machine progression mentioned above in the overview on the right.

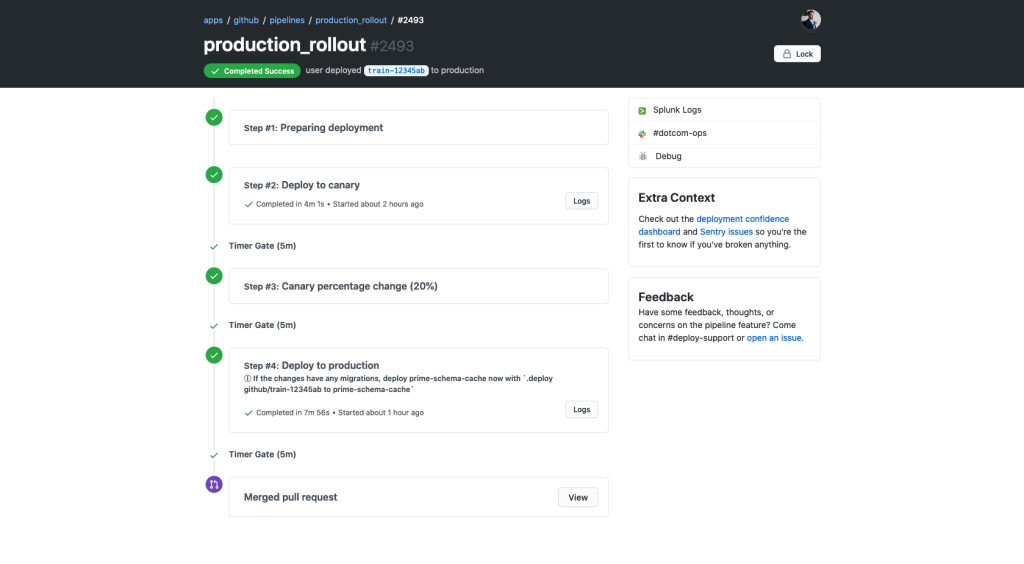
Drilling down into a specific deployment, you can see everything that has happened during a specific deployment. You can see that each stage of this deployment has an automatic 5-minute timer between them, and the ability to pause the deployment to give a developer more time to test. We also made sure that, in the case something is wrong, we have a quick way to rollback or revert the changes with the dropdown in the top right corner.

Finally, the entire system could be monitored and started from Slack – just like before. We found that this is how developers typically want to start their deploys, followed by monitoring in the UI component:

The results
These changes have revolutionized the way we deploy GitHub.com. Where confusion and frustration had once set in, we now have joy and content at the use of an automated system. We have received overwhelmingly positive feedback internally, and even attracted some attention from our very own Actions team. Our learnings, in this case, helped to inform and influence the decisions in the recent GitHub Actions CD offering announced at GitHub Universe. Our focus on our own developers means that we can apply our learnings to continue creating the best possible system for the 56M+ developers around the world.
Our work this past summer could not have been possible without the dedication and work from many people and teams. We’d like a special shoutout to the GitHub internal deploy team: their existing system, advice, and ongoing help was crucial in making sure our deploys were successful.
Part of the Building GitHub blog series.
Written by
Related posts

Automate repository tasks with GitHub Agentic Workflows
Discover GitHub Agentic Workflows, now in technical preview. Build automations using coding agents in GitHub Actions to handle triage, documentation, code quality, and more.

Level up design-to-code collaboration with GitHub’s open source Annotation Toolkit
Prevent accessibility issues before they reach production. The Annotation Toolkit brings clarity, compliance, and collaboration directly into your Figma workflow.

How to use the GitHub and JFrog integration for secure, traceable builds from commit to production
Connect commits to artifacts without switching tools.