Why (and how) GitHub is adopting OpenTelemetry
Over the years, GitHub engineers have developed many ways to observe how our systems behave. We mostly make use of statsd for metrics, the syslog format for plain text logs…

Over the years, GitHub engineers have developed many ways to observe how our systems behave. We mostly make use of statsd for metrics, the syslog format for plain text logs and OpenTracing for request traces. While we have somewhat standardized what we emit, we tend to solve the same problems over and over in each new system we develop.
And, while each component serves its individual purpose well, interoperability is a challenge. For example, several pieces of GitHub’s infrastructure use different statsd dialects, which means we have to special-case our telemetry code in different places – a non-trivial amount of work!
Different components can use different vocabularies for similar observability concepts, making investigatory work difficult. For example, there’s quite a bit of complexity around following a GitHub.com request across various telemetry signals, which can include metrics, traces, logs, errors and exceptions. While we emit a lot of telemetry data, it can still be difficult to use in practice.
We needed a solution that would allow us to standardize telemetry usage at GitHub, while making it easy for developers around the organization to instrument their code. The OpenTelemetry project provided us with exactly that!
Introducing OpenTelemetry
OpenTelemetry introduces a common, vendor-neutral format for telemetry signals: OTLP. It also enables telemetry signals to be easily correlated with each other.
Moreover, we can reduce manual work for our engineers by adopting the OpenTelemetry SDKs – their inherent extensibility allows engineers to avoid re-instrumenting their applications if we need to change our telemetry collection backend, and with only one client SDK per-language we can easily propagate best practices among codebases.
OpenTelemetry empowers us to build integrated and opinionated solutions for our engineers. Designing for observability can be at the forefront of our application engineer’s minds, because we can make it so rewarding.
What we’re working on, and why
At the moment, we’re focusing on building out excellent support for the OpenTelemetry tracing signal. We believe that tracing your application should be the main entry point to observability, because we live in a distributed-systems world and tracing illuminates this in a way that’s almost magical.
We believe that tracing allows us to naturally and easily add/derive additional signals once it’s in place: many metrics, for example, can be calculated by backends automatically, tracing events can be converted to detailed logs automatically, and exceptions can automatically be reported to our tracking systems.
We’re building opinionated internal helper libraries for OpenTelemetry, so that engineers can add tracing to their systems quickly, rather than spending hours re-inventing the wheel for unsatisfying results. For example, our helper libraries automatically make sure you’re not emitting traces during your tests, to keep your test suites running smoothly:
# in an initializer, or config/application.rb
OpenTelemetry::SDK.configure do |c|
  if Rails.env.test?
    c.add_span_processor(
      # In production, you almost certainly want BatchSpanProcessor!
      OpenTelemetry::SDK::Trace::Export::SimpleSpanProcessornew(
        OpenTelemetry::SDK::Trace::Export::NoopSpanExporter.new
      )
    )
  end
end
The OpenTelemetry community has started writing libraries that automatically add distributed tracing capabilities to other libraries we rely on – such as the Ruby Postgres adapter, for example. We believe that careful application of auto-instrumentation can yield powerful results that encourage developers to customize tracing to meet their specific needs. Here, in a Rails application that did not previously have any tracing, the following auto-instrumentation was enough for useful, actionable insights:
# in an initializer, or config/application.rb
OpenTelemetry::SDK.configure do |c|
  c.use 'OpenTelemetry::Instrumentation::Rails'
  c.use 'OpenTelemetry::Instrumentation::PG', enable_sql_obfuscation: true
  c.use 'OpenTelemetry::Instrumentation::ActiveJob'
  # This application makes a variety of outbound HTTP calls, with a variety of underlying
  # HTTP client libraries - you may not need this many!
  c.use 'OpenTelemetry::Instrumentation::Faraday'
  c.use 'OpenTelemetry::Instrumentation::Net::HTTP'
  c.use 'OpenTelemetry::Instrumentation::RestClient'
end
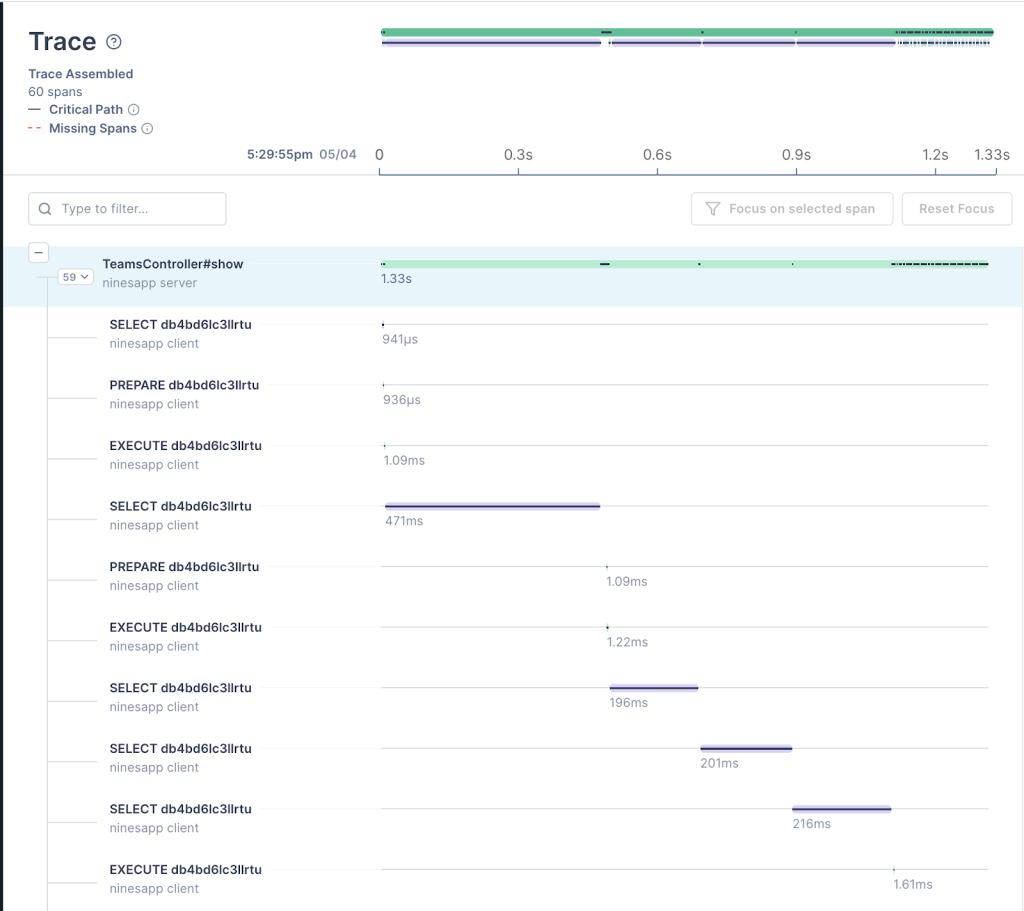
This short sample is the standard way to configure the OpenTelemetry SDK—and each c.use line tells the SDK to load and initialize a certain set of auto-instrumentation for us. After that’s happened, we can immediately gain insight into a poorly performing page! This request tracing view below demonstrates a full, crystal-clear trace of database operations from auto-instrumentation alone:

We’re building intelligent automatic correlation of the signals that we have today, with OpenTelemetry tracing as the root. By adding trace identifiers into log lines automatically we can connect request traces to logs for example. We have exciting plans about automatically building useful and relevant dashboards, alerts and tools for teams based on these signals. As our OpenTelemetry efforts progress, we’ll shift our focus towards our logging and metrics systems, for the times when tracing isn’t enough. And we’re contributing as much as we can back to the OpenTelemetry project, for everyone to use!
Why should you be excited and how should you get involved?
OpenTelemetry is a CNCF project and it’s been up and running for quite some time. It’s a project with an incredibly wide scope, and one that we believe has real potential to transform how our entire industry approaches one of the most necessary aspects of our work—how to observe and understand our systems. That’s why we’re so excited about it, and why we’re introducing it to our engineers.
Better, more observable distributed systems are possible, and together we have the opportunity to shape them. If it’s interesting to you, we invite you to join the OpenTelemetry community in improving observability for everyone. And if you want to help us make our internal developer experience better, we invite you to join us!
Written by
Related posts

Continuous AI for accessibility: How GitHub transforms feedback into inclusion
AI automates triage for accessibility feedback, allowing us to focus on fixing barriers—turning a chaotic backlog into continuous, rapid resolutions.

How we rebuilt the search architecture for high availability in GitHub Enterprise Server
Here’s how we made the search experience better, faster, and more resilient for GHES customers.

From pixels to characters: The engineering behind GitHub Copilot CLI’s animated ASCII banner
Learn how GitHub built an accessible, multi-terminal-safe ASCII animation for the Copilot CLI using custom tooling, ANSI color roles, and advanced terminal engineering.