Workload Analysis with MySQL’s Performance Schema
Earlier this spring, we upgraded our database cluster to MySQL 5.6. Along with many other improvements, 5.6 added some exciting new features to the performance schema. MySQL’s performance schema is…
Earlier this spring, we upgraded our database cluster to MySQL 5.6. Along with many other improvements, 5.6 added some exciting new features to the performance schema.
MySQL’s performance schema is a set of tables that MySQL maintains to track internal performance metrics. These tables give us a window into what’s going on in the database—for example, what queries are running, IO wait statistics, and historical performance data.
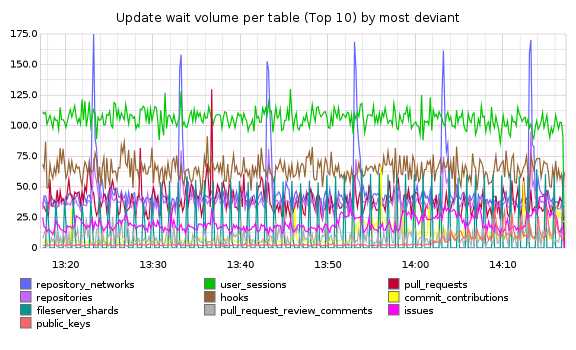
One of the tables added to the performance schema in 5.6 is table_io_waits_summary_by_index. It collects statistics per index, on how many rows are accessed via the storage engine handler layer. This table already gives us useful insights into query performance and index use. We also import this data into our metrics system, and displaying it over time has helped us track down sources of replication delay. For example, our top 10 most deviant tables:

MySQL 5.6.5 features another summary table: events_statements_summary_by_digest. This table tracks unique queries, how often they’re executed, and how much time is spent executing each one. Instead of SELECT id FROM users WHERE login = 'zerowidth', the queries are stored in a normalized form: SELECT `id` FROM `users` WHERE `login` = ?, so it’s easy to group queries by how they look than by the raw queries themselves. These query summaries and counts can answer questions like “what are the most frequent UPDATES?” and “What SELECTs take the most time per query?”.
When we started looking at data from this table, several queries stood out. As an example, a single UPDATE was responsible for more than 25% of all updates on one of our larger and most active tables, repositories: UPDATE `repositories` SET `health_status` = ? WHERE `repositories` . `id` = ?. This column was being updated every time a health status check ran on a repository, and the code responsible looked something like this:
class Repository
  def update_health_status(new_status)
    update_column :health_status, new_status
  end
end
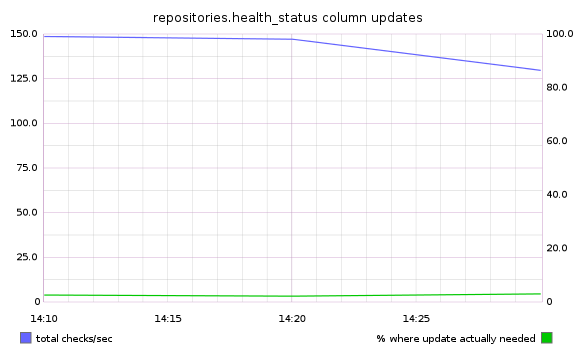
Just to be sure, we used scientist to measure how often the column needed to be updated (had the status changed?) versus how often it was currently being touched:

The measurements showed what we had expected: the column needed to be updated less than 5% of the time. With a simple code change:
class Repository
  def update_health_status(new_status)
    if new_status != health_status
      update_column :health_status, new_status
    end
  end
end
The updates from this query now represent less than 2% of all updates to the repositories table. Not bad for a two-line fix. Here’s a graph from VividCortex{: data-proofer-ignore=”true”}, which shows query count data graphically:

GitHub is a 7-year-old rails app, and unanticipated hot spots and bottlenecks have appeared as the workload’s changed over time. The performance schema has been a valuable tool for us, and we can’t encourage you enough to check it out for your app too. You might be surprised at the simple things you can change to reduce the load on your database!
Here’s an example query, to show the 10 most frequent UPDATE queries:
SELECT
  digest_text,
  count_star / update_total * 100 as percentage_of_all
FROM events_statements_summary_by_digest,
( SELECT sum(count_star) update_total
  FROM events_statements_summary_by_digest
  WHERE digest_text LIKE 'UPDATE%'
) update_totals
WHERE digest_text LIKE 'UPDATE%'
ORDER BY percentage_of_all DESC
LIMIT 10
Written by
Related posts

The uphill climb of making diff lines performant
The path to better performance is often found in simplicity.

Continuous AI for accessibility: How GitHub transforms feedback into inclusion
AI automates triage for accessibility feedback, allowing us to focus on fixing barriers—turning a chaotic backlog into continuous, rapid resolutions.

How we rebuilt the search architecture for high availability in GitHub Enterprise Server
Here’s how we made the search experience better, faster, and more resilient for GHES customers.