Improvement
Track organization code quality trends
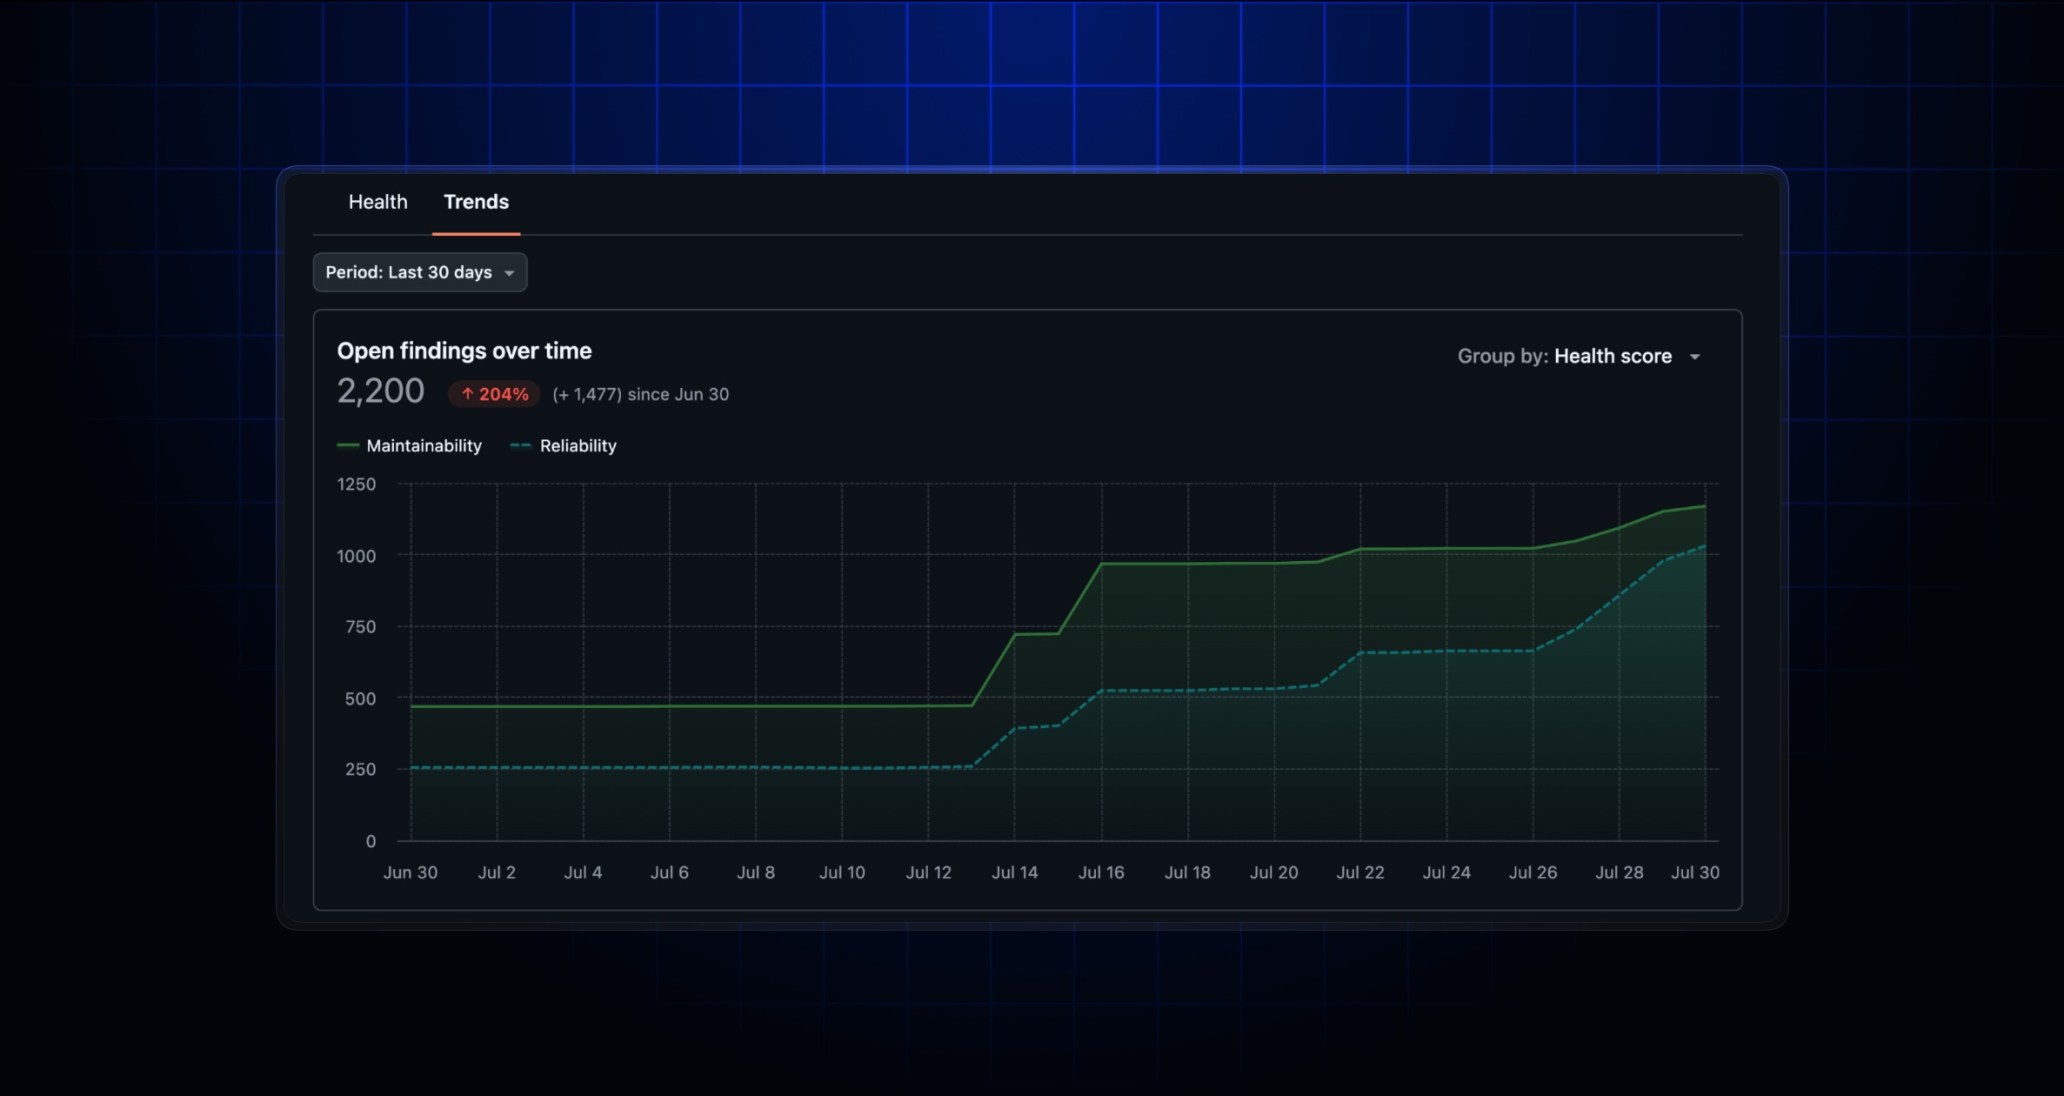
The organization-level Code Quality dashboard now includes a Trends tab that shows how code quality has changed across your repositories over time. Instead of a point-in-time snapshot, you can see whether open findings are trending up or down and which repositories are driving the change.
With this release, you can:
- See findings change over time: The trend graph plots open findings across a date range of 7, 14, or 30 days, grouped by health score or severity. Alongside the graph you get your current total open findings and the net change since the start of the period.
- Find your most improved repositories or repositories that need support: Dedicated tables rank repositories by how much their open findings have changed. Spot which teams are making progress and which repositories need attention.
- Focus on the repositories you care about: The graph and both tables respect the repository filters you apply at the top of the page.
Organization-level quality trends are generally available for organizations on the GitHub Enterprise Cloud and GitHub Team plans with GitHub Code Quality enabled, as well as on GitHub Enterprise Cloud with data residency. This feature is not available on GitHub Enterprise Server. Learn more in the GitHub Code Quality documentation.
Join the discussion and share feedback in the GitHub Code Quality announcement.