Rule insights dashboard and unified filter bar
Rule insights dashboard
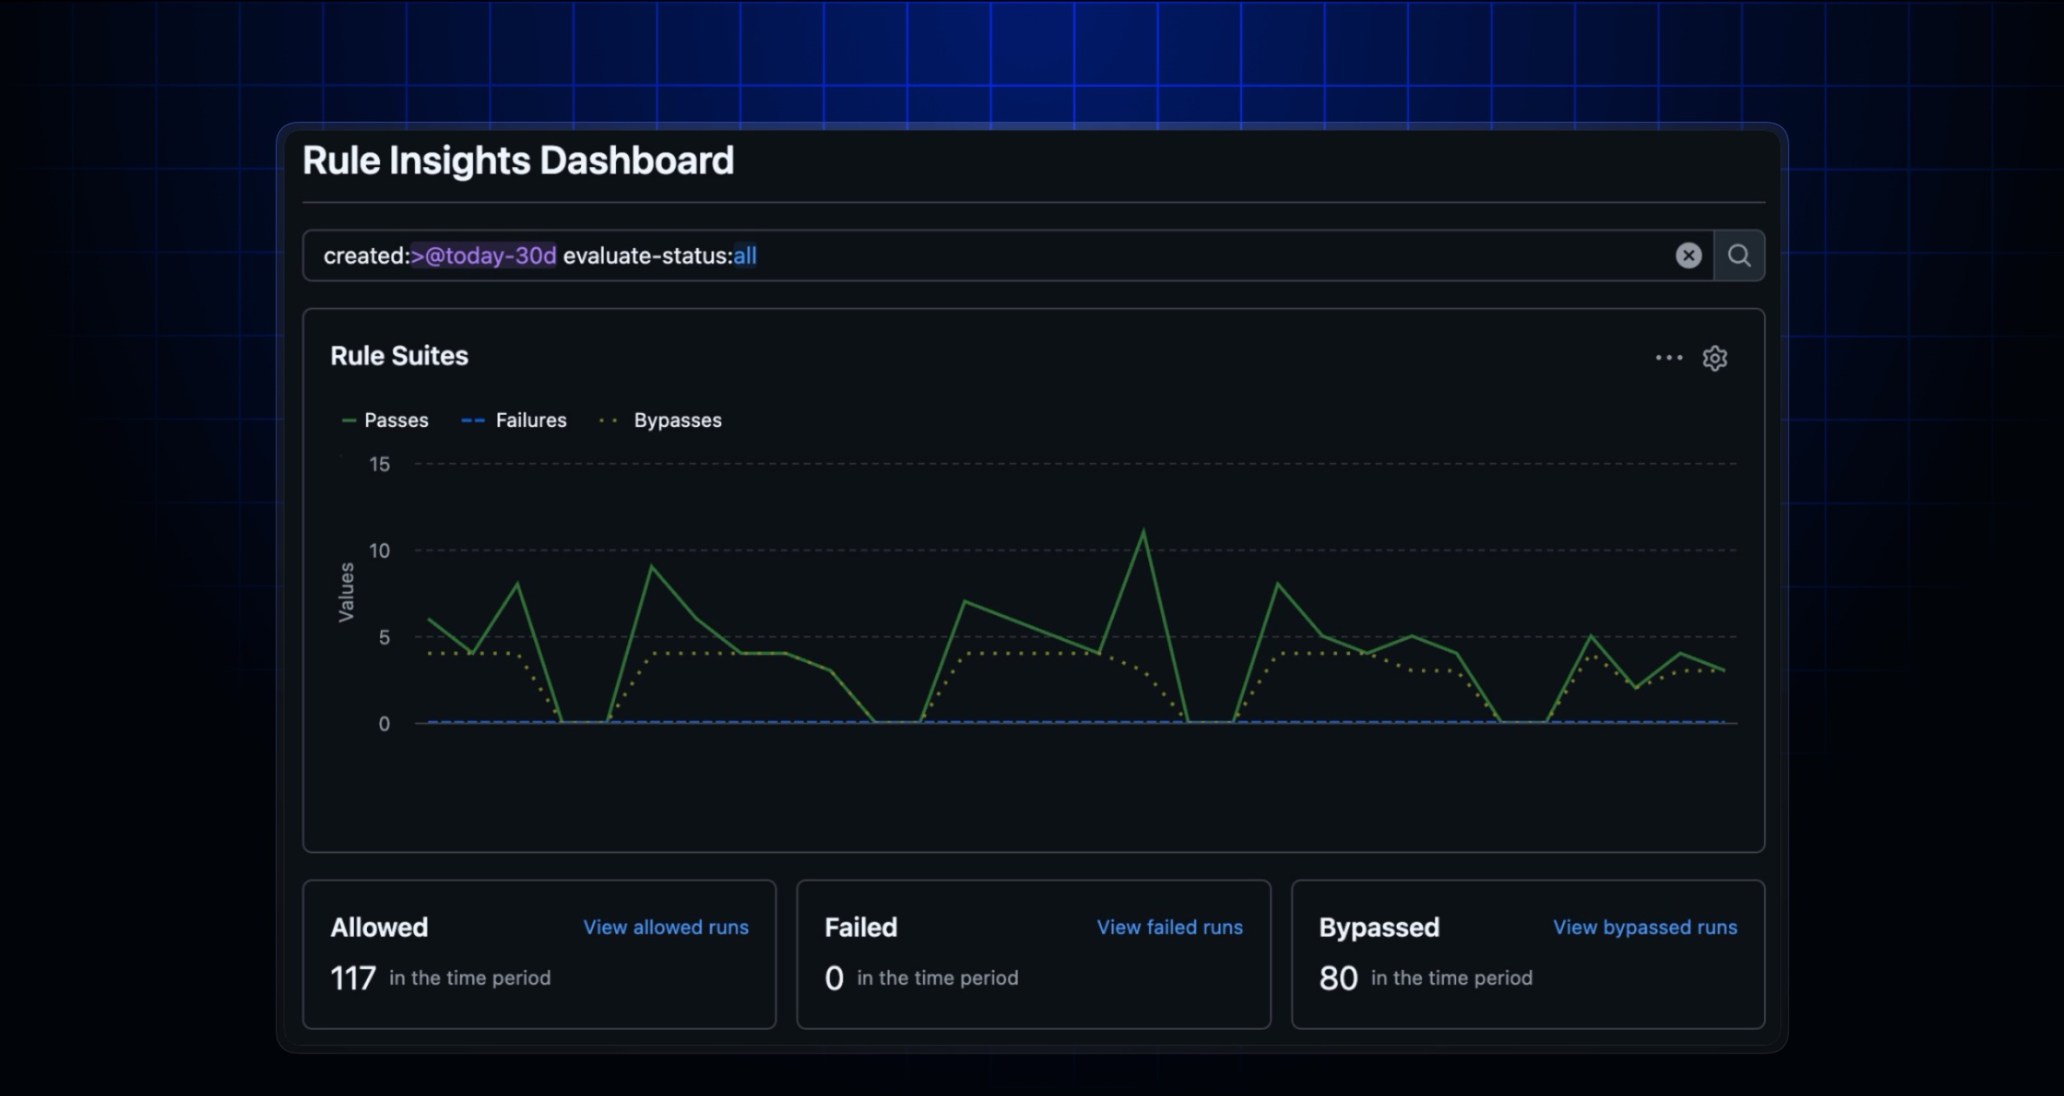
GitHub repository rulesets are powerful, but it hasn’t been easy to spot trends like spikes in blocked pushes during an incident or patterns in bypass activity without digging through data in the rule insights page.
The new rule insights dashboard is now available in your repository’s Settings > Rules tab. It gives you a visual, high-level view of rule evaluation activity, including:
- Successes, failures, and bypasses over time
- The most active bypassers for your rulesets
Each chart links back to the rule insights page with filters prefilled, so you can quickly drill into specific statuses, bypassers, or time ranges.
Whether you’re responding to an incident or auditing bypass activity, the dashboard helps you spot trends at a glance and jump to the details when you need them.
Unified filter bar for alert dismissal and bypass request pages
Building on the filter bar improvements shipped in February, we’ve replaced custom dropdowns on several alert management pages with the same unified filter bar component. This affects:
- GitHub code scanning alert dismissal requests at the enterprise and organization levels.
- GitHub Dependabot alert dismissal requests at the enterprise and organization levels.
- GitHub secret scanning alert dismissals at the enterprise and organization levels.
- GitHub secret scanning push protection bypass requests at the enterprise, organization, and repository levels.
You now get a consistent filtering experience, including support for custom properties, across all of these pages.
Learn more about GitHub repository rulesets.
These experiences are available in public preview.