The GitHub BlogUpdates, ideas, and inspiration from GitHub to help developers build and design software.2024-11-07T00:05:44Zhttps://github.blog/feed/atom/WordPresshttps://github.blog/wp-content/uploads/2019/01/cropped-github-favicon-512.png?fit=32%2C32Lee Reillyhttps://leereilly.net<![CDATA[Game Off 2024 theme announcement]]>https://github.blog/?p=804842024-11-01T20:37:40Z2024-11-01T20:36:22ZGitHub’s annual month-long game jam, where creativity knows no limits! Throughout November, dive into your favorite game engines, libraries, and programming languages to bring your wildest game ideas to life. Whether you're a seasoned dev or just getting started, it’s all about having fun and making something awesome!
]]>Get ready for our annual game jam, Game Off! Whether you’ve been a participant for years or you’re hearing about it for the first time, this is your chance to create something extraordinary throughout November. The theme for this year? SECRETS. Intriguing, right? What kind of hidden stories, covert missions, or untold mysteries will you reveal? That’s entirely up to you.
You have until December 1 at 13:37 PST to build a game loosely based on the theme—how you interpret it is entirely up to you.
secret /ˈsiː.krət/ Noun
Information or knowledge deliberately kept hidden (for example, family secrets or secret recipes).
A mystery or unknown fact (for example, the secret to being a 10X developer).
Silly Elders Conducting Ridiculous Espionage Training Simulators
Stealthy Enemies Creating Really Elaborate Trap Systems
Some Evil Computers Running Everything Too Smartly
[ YOUR ACRONYMS HERE ]
Need inspiration? Here are a few concept ideas:
Top-down adventure: explore a mysterious temple filled with hidden chambers and secret passages, revealing lost treasures and forgotten lore.
Stealth platformer: infiltrate a secret society’s headquarters, using gadgets and shadows to remain undetected
AR treasure hunt: use real-world surroundings to find hidden clues that lead to a secret treasure.
Hacking simulator: circumvent security systems and use social engineering to gather passwords and access tokens before time runs out. Maybe even hack time itself!
CLI text adventure: help hero Marty troubleshoot his life now that he has no more secrets to hide.
A game about the Secret Life of NPCs. Ever wonder what the shopkeeper does when you’re not around? Now’s your chance to find out.
New this year: wildcards (for extra nerd cred)
We’re introducing wildcards—optional challenges to give your games some extra flair, inspired by Global Game Jam’s “diversifiers” and Godot Wild Jam’s “wildcards”.
Create a public repository. Store your source code on GitHub—open-source magic at its finest. Push your game before December 1 at 13:37 PST.
Submit your game on itch.io. Once submitted, you’ll be able to play other entries and cast your votes!
Voting
After the submission period ends, participants will vote on each other’s games. Entries will be evaluated in the following categories:
Overall
Gameplay
Graphics
Audio
Innovation
Theme Interpretation
Voting will end on January 8, 2025, at 13:37 PST. Winners will be announced on GitHub 𝕏 and the GitHub Blog on January 10, 2025, at 13:37 PST.
New to game development?
Game jams are a great excuse to build your first game, play with a new game engine, or learn a new language. There are plenty of free, open source and “source available” engines to explore. Here are a few suggestions for some popular languages:
JavaScript: you might be interested in Phaser or Sprig.
Python: check out Pygame or Godot (Godot uses GDScript, which is similar to Python).
Lua: check out LÖVE or Defold or LIKO-12 (especially if you like retro games)!
The Game Off 2024 Community is a great place to ask questions or look for teammates. There’s also a fantastic and friendly community-run Discord server
New to Git or GitHub?
Game Off is the perfect opportunity to check it out (version control pun intended)!
Git Documentation: learn everything about version control and how to get started.
GitHub Help: explore tutorials and FAQs about GitHub.
]]>Laura Lindeman<![CDATA[Celebrating the GitHub Awards 2024 recipients 🎉]]>https://github.blog/?p=810252024-11-07T00:05:44Z2024-10-30T21:30:54ZThe GitHub Awards celebrates the outstanding contributions and achievements in the developer community by honoring individuals, projects, and organizations for creating an outsized positive impact on the community.
The GitHub Awards celebrates the outstanding contributions and achievements in the developer community by honoring individuals, projects, and organizations for creating an outsized positive impact on the community.
We announced these awards live at GitHub Universe 2024, but here’s a recap for those who missed it!
Open Source Awards
Wonderfully Welcoming Award
Home Assistant is an open source home automation tool–think light bulbs, thermostats, and more–that has an incredibly engaged global community of self-described tinkerers and DIY enthusiasts. It integrates with tons of different devices and services and processes your data locally. *(It’s true: a handful of Raspberry Pis running in a guest bedroom can automate, seemingly, your entire house!) *Home Assistant has been the top open source project by contributors in our annual Octoverse report for two years running and this year claimed the second spot for attracting the most first-time contributors. Wonderfully Welcoming, indeed!
The Wonderfully Welcoming Award recognizes people or projects that have been the most welcoming and seen an increasing amount of contributors.
Noteworthy Newcomer Award
Abi Raja’s project, screenshot-to-code works exactly as advertised. This innovative tool leverages AI to convert screenshots, mockups and even Figma designs into functional front-end code (HTML, Tailwind, React, Vue, and more). It helps developers prototype faster and bring their designs to life with minimal manual effort.
The Noteworthy Newcomer Award recognizes people or projects that are creating and sharing breakthrough contributions/projects.
Global Grandiose Award
Congratulations to GatsbyJS, the winner of the Global Grandiose Award! 🎉 With over 4,000 contributors from 112 countries, GatsbyJS has built a truly global and diverse community. Its powerful, React-based framework enables developers everywhere to create fast, high-performance websites.
The Global Grandiose Award recognizes projects that have a large global community of contributors.
Awesome AI Award
Everyone’s talking about AI, so we’ve added the Awesome AI Award this year to recognize an open source AI project that has a significant impact for developers (and an awfully cute logo). The inaugural winner is Ollama, which helps developers get up and running with large language models (LLMs). It rocketed into the top 10 open source projects in this year’s Octoverse report as the fastest-growing project by contributors. Get a load of these models and try it out today!
The Awesome AI Award recognizes an open source AI project helping create significant impact to developers.
Supply Chain Sentinel Award
If you hang out in GitHub Security Lab’s Slack, go to security conferences, or generally keep up with the latest on CodeQL, you’ve probably come across Simon Gerst. He’s made noticeable contributions to the CodeQL practitioner community through the workshops he delivers at conferences and his activity in the Security Lab Slack channel, where he tirelessly answers questions and helps others write their CodeQL queries. Thank you, Simon!
The Supply Chain Sentinel Award recognizes a community member who has contributed to make the software supply chain more secure, by finding, disclosing, or fixing security vulnerabilities in open source projects or in supply chain tooling, or by providing information on known vulnerabilities to the ecosystem.
Audience Choice Award
Winners of the Audience Choice Award were voted on by GitHub Universe attendees and viewers at home.
Prisma is an open source ORM (Object-Relational Mapping) tool that simplifies database access for developers. It provides type-safe queries and seamless integration with JavaScript and TypeScript, making it easier to work with relational databases like PostgreSQL, MySQL, and SQLite. Prisma abstracts the complexity of database management while offering high flexibility, making it a popular choice among modern backend developers. A huge shoutout to Prisma for empowering developers to ship faster, with confidence, and without sacrificing control! 🥂🎉
The Audience Choice Award recognizes a project that has been voted by developers as a project that has helped them create an impact.
Education Awards
Lighthouse Award
Manitej, 17, from Houston, Acon, 18, from Toronto, and Belle, 19 from Malaysia, ran the 2024 Summer Arcade, where any teenager globally could hack on an open source project, log their hours, and redeem awesome prizes. These organizers used GitHub Copilot to code the bots that powered Arcade, and wrote GitHub integrations that analyzed student projects. Through the campaign, 5,000 teenagers around the world logged over 135,000 hours of coding, and many deployed their first lines of code on GitHub, none of which would have been possible without the work of the Summer Arcade organizers. Thank you Manitej, Acon, and Belle for encouraging your peers and the next generation to learn how to code and collaborate on software to build cool things!
(Psst, if this sounds cool, see what Hack Club and GitHub are doing next with High Seas, a global challenge to every teenager on the planet to spend their winters coding open source projects.)
The Lighthouse Award recognizes students who lead fellow learners by shining a light to their communities through open source.
Empowering Educator Award
Does your professor shepherd new open source contributors and promote diversity in computing? This one (Empowering Educator Award winner, Dr. Emily Lovell) does! Dr. Emily Lovell is a Postdoctoral Fellow at the University of California Santa Cruz’s Open Source Program Office (OSPO). Her research and teaching use novel domains to invite broader participation in computing, with her postdoctoral work focusing on newcomers to open source. She leads the Contributor Catalyst program at UC Santa Cruz and has, for the past two summers, hosted a cohort of students from HBCUs and supported them in becoming productive contributors and members of GitHub-hosted open source projects and communities, such as OpenSSF Scorecard, p5.js, and Mozilla Firefox DevTools. This year, she was awarded a $1M grant from the National Science Foundation to expand her work over the next three years to five more HBCU partner universities! Beyond the classroom, Emily serves on UCSC’s largest student-run hackathon advisory board, mentors for Google Summer of Code, and partners with student groups to promote open source education.
The Empowering Education Award recognizes educators and teachers who provide support and answers to fellow members of their communities.
Phenomenal Education Partner Award
Codédex is a brand new way to learn to code online. The platform provides a way for learners to earn experience points (XP) as they journey through the fantasy land of Python, HTML, CSS, JavaScript, React, Command Line, and Git & GitHub, unlock new regions, and collect badges at their own pace. (Cue the Super Mario Bros PowerUp sound effect!) At only two-years-old, Codédex is already used in over 800 high schools and colleges in the United States, Canada, Japan, Spain, Mexico, Colombia, and India. GitHub first partnered with Codédex in Spring of 2024. Since then, they’ve held monthly challenges, hosted hackathons, and built engaging projects that have been enjoyed by an active user base of over 200,000 people. They also hit the road for a 2024 Fall Campus Tour, which included workshops, swag, and support to some of the biggest coding clubs at colleges across the North American east coast. Codédex hits the spot of community and collaboration for a generation of hungry young coders.
The Phenomenal Education Partner Award recognizes GitHub Education partners that provide strong support and opportunities for students, teachers, and schools.
Customer Awards
OSPO Leadership Award
Zerodha, one of India’s largest stock broking platforms,has demonstrated an unwavering commitment to the future of open source. They consistently share their projects and support global open source initiatives. Recently, they introduced a $1 million per year, no-strings-attached funding program to further support open source development. Their strong examples inspire a wide range of organizations to embrace open source practices and contribute to the ecosystem.
The OSPO Leadership Award recognizes OSPOs who have demonstrated that it’s not only possible to innovate in the enterprise by focusing on open source, it’s essential. By separating out and addressing the real business risks and organizational challenges from FUD and inertia, successful OSPOs are blazing a trail for the industry as a whole to use, contribute to, and publish open source software.
AI Champion Award
Sumeet Shetty is the Head of Tools India at SAP, where he’s enabled thousands of developers to supercharge development with Copilot. A dedicated and knowledgeable GitHub Champion, Sumeet has shared his thought leadership to showcase how his organization leverages Copilot to uplevel developer experience.
The AI Champion Award recognizes GitHub’s brightest customer champions who have shared their best-in-class stories and thought leadership spotlighting how they have transformed their developer organizations, enabling our community to learn from their insights and apply these learnings back to their own GitHub journey.
GitHub for Good
What kinds of high-impact problems could be addressed with AI? The Hive, USA for UNHCR’s data science and innovation lab, conducted research to address the growing need for refugee housing. According to UNHCR, 22% of the 43 million refugees around the world live in camps—temporary facilities built to respond to specific emergencies. And as the need for refugee housing grows, the planning becomes more complex. Through their research, The Hive uncovered possible AI solutions to make this work easier. That’s just one way The Hive is putting modern advances to work solving real-world problems and using technology to do good.
The GitHub for Good Award recognizes a nonprofit or social sector organization who has leveraged GitHub for good to empower developers to make a positive difference in the world.
Partner Awards
Overall Channel Partner of the Year
Offering specialized expertise in application development, cloud deployment services, GitHub migration and integration, and more, not to mention support in English, French, and German, GitHub channel partner Xebia has excelled across regions and categories of work. They demonstrate exceptional innovation and deliver significant value to our mutual customers. Xebia has been a true leader in collaboration and growth within the GitHub ecosystem.
This award recognizes the channel partner that has demonstrated excellence across multiple areas, including platform utilization, AI integration, security implementation, customer satisfaction, and overall business impact, contributing significantly to GitHub’s success.
Global Systems Integrator Partner of the Year
NTT Data has driven significant business impact by integrating GitHub into enterprise environments, fostering innovation, accelerating digital transformation, and empowering developers worldwide. Their strategic alignment with GitHub and commitment to customer success have set a new standard for excellence in the global partner ecosystem.
This award recognizes the GSI channel partner that has demonstrated excellence across multiple areas, including platform utilization, AI integration, security implementation, customer satisfaction, and overall business impact, contributing significantly to GitHub’s success.
Technology Partner of the Year
You might say that GitHub and ARM go, well, arm in arm, having worked closely together for several years and recently shipping ArmⓇ-based Linux and Windows runners for GitHub Actions, which modernizes and accelerates development workflows from the cloud to the edge.
As part of our Technology Partnership Program, ARM is continuing to build and extend developer access with their GitHub Copilot Extension.
This collaboration scales and democratizes access to ARM’s 100 million developer ecosystem.
The GitHub Technology Partner of Year Award acknowledges outstanding success and innovations by a technology partner on the GitHub platform.
]]>Mario Rodriguez<![CDATA[New from Universe 2024: Get the latest previews and releases]]>https://github.blog/?p=807352024-11-06T00:16:38Z2024-10-29T16:40:23ZFind out how we’re evolving GitHub and GitHub Copilot—and get access to the latest previews and GA releases.
This year marks our tenth GitHub Universe—and one theme has remained constant: our focus on developers and the developer experience. Over 10 years, that developer experience has evolved from inventing the pull request to building the world’s most widely adopted AI coding tool, GitHub Copilot.
Today, our platform serves more than 100 million developers, and through the power of this interconnected community combined with generative AI, we are enabling every developer to build, release, scale, and secure software rapidly.
We have a lot to cover. As developers, we’re not known for being patient. So, let’s jump in.
Introducing new, powerful AI-native experiences
The best model for the task: the power of developer choice
We are bringing developer choice to GitHub Copilot with Anthropic’s Claude 3.5 Sonnet, Google’s Gemini 1.5 Pro, and OpenAI’s o1-preview and o1-mini. These new models will be rolling out—first in Copilot Chat, with OpenAI o1-preview and o1-mini available now, Claude 3.5 Sonnet rolling out progressively over the next week, and Google’s Gemini 1.5 Pro in the coming weeks. From Copilot Workspace to multi-file editing to code review, security autofix, and the CLI, we will bring multi-model choice across many of GitHub Copilot’s surface areas and functions soon.
Whether it’s in VS Code or on GitHub.com, individual developers can now decide which models work best for them, while organizations and enterprises have full control over which models they enable for their team. Try multi-model Copilot today!
With Copilot Workspace in pull requests, you can rapidly refine, validate, and land Copilot-generated code suggestions coming from Copilot code review, Copilot Autofix, and third-party Copilot Extensions. Get your pull requests “ready to merge” faster than ever. Learn about GitHub Copilot Workspace and Copilot Code Reviews >
Bring your ideas to life with GitHub Spark
It starts with an idea. It always does. When we’re kids, we have thousands of them. Many of them are silly. Some of them are crazy. Today, we are giving you a new product to try all of them. We call it GitHub Spark—it’s powered by natural language, and it sets the stage for our vision to help 1 billion people become developers. This is about fun and personal software, not about enterprise productivity apps. With live history, previews, and the ability to edit code directly, GitHub Spark allows you to create micro apps that take that crazy small, fun idea and bring it to life. Go and play… Learn about the GitHub Spark technical preview >
Increasing your productivity with the Copilot-powered developer platform
Momentum is our oxygen. And that is why we are announcing a wide range of improvements to accelerate how you build, release, scale, and secure software. Get ready to unlock your creativity.
Raising the quality of your Copilot-powered experiences
These updates enhance your development workflow with new features like multi-model choice, improved code completion, implicit agent selection in GitHub Copilot Chat, better support for C++ and .NET, and expanded availability in Xcode and Windows Terminal. READ MORE ⤵️
Multi-model choice and access to OpenAI’s o1 model in GitHub Copilot. Toggle between different AI models during conversations, seamlessly switching from explaining APIs or generating boilerplate code to designing complex algorithms or analyzing logic bugs. Copilot users now have access to the o1-preview and o1-mini models in Copilot Chat and GitHub Models.
Custom instructions. Specify custom instructions to personalize Copilot Chat responses in VS Code and Visual Studio, based on your preferred tools, organizational knowledge, and coding conventions.
Improvements to code completion and chat quality. Enjoy enhanced contextual performance along with a preview of a new debugging experience initiated through Copilot Chat.
Selection of agents in Copilot Chat. Copilot Chat in VS Code can automatically invoke internal and external agents—such as @workspace, @github, and other installed Copilot extensions—to provide more relevant responses.
Better language support for C++ and .NET. Improved C++ completion quality in VS Code and Visual Studio with more relevant context. Plus, Copilot Chat now has increased performance in project-specific properties for C++ and .NET in Visual Studio.
GitHub Copilot for Xcode. GitHub Copilot code completion is now available in Xcode, enabling macOS and iOS developers to leverage its capabilities.
We’re introducing several updates to GitHub Copilot to boost productivity across various IDEs, including new @github skills, error explanations, and improved code assistance. READ MORE ⤵️
Improved skills and search in Copilot Chat. Search across GitHub for commits, issues, pull requests, repositories, and releases directly from Copilot Chat in VS Code.
Explain and fix C++ and C# errors in Visual Studio. Use GitHub Copilot to understand and resolve C++ and C# errors within Visual Studio.
Quick info on C++ and C# in Visual Studio. Instantly learn about C++ and C# symbols by hovering to invoke Copilot in the Quick Info dialog.
Improved code referencing. Easily see if a code suggestion matches public code, including file locations and licensing information.
Bing integration in Copilot Chat. Search with Bing directly from Copilot Chat in VS Code and Visual Studio for Individual and Business users.
.NET test debugging. Debug .NET code tests seamlessly within Visual Studio.
Simplifying your workflows with GitHub Copilot Extensions
Whether you’re an individual developer looking to streamline your workflow or an organization aiming to integrate proprietary tools, GitHub Copilot Extensions now offers a platform to make that happen and to share your creations on the GitHub Marketplace. READ MORE ⤵️
GitHub Copilot Extensions. Extend GitHub Copilot with ready-to-use extensions, build your own, and get access to third-party applications and internal systems for a more personalized experience.
GitHub Copilot for Azure. Deploy and manage Azure services, find and deploy application templates, and diagnose and troubleshoot application issues.
Making it easy to build generative AI applications with GitHub Models
GitHub Models makes it simple to use, compare, experiment, and build with AI models from OpenAI, Cohere, Microsoft, Mistral, and more. Starting today, developers and AI engineers can access new capabilities on GitHub Models, including side-by-side model comparison, support for multi-modal models, the ability to save and share prompts and parameters, and new cookbooks and SDK support in GitHub Codespaces.
A more secure developer experience where found means fixed
Security should never be a bottleneck for developers. That’s why we’re making it part of the development process with GitHub Copilot Autofix. Our goal is simple: when a vulnerability is found, it gets fixed—fast.
More secure code from the IDE to production
We know developers are often on the front lines of security. That’s why we want to make it easier for you to write more secure code from start to finish with Copilot Autofix, our Copilot-powered vulnerability remediation tool, now reaching further into your workflows and code. READ MORE ⤵️
Improved CodeQL coverage. Address security debt and historical CodeQL alerts with Copilot-generated fixes that cover more than 90% of alert types in JavaScript, Typescript, Java, Python, Ruby, C#, C/C++, and Go.
Copilot secret scanning. Copilot secret scanning, which detects generic passwords using AI, offers greater precision for unstructured credentials that can cause security breaches if exposed. Over 350,000 repositories have already enabled this password detection.
New partner integrations. Integrate Copilot Autofix natively with supported partner code scanning tools of your choice, starting with ESLint, JFrog SAST, and Black Duck’s Polaris™ platform (powered by Coverity®).
Copilot Autofix for Dependabot. Get natural language explanations and pull request code suggestions to update between major versions of dependencies seamlessly.
Enterprise-grade experiences that put you in control
From powerful new GitHub Actions runners to enhanced project management tools (and a whole lot more), we’re investing in increasing your iteration velocity while keeping you compliant at every step.
Improved controls for governance and compliance
We know maintaining governance and compliance is critical for you—and definitely for your administrators. That’s why we’re introducing new features to give admins more control over user management, repository policies, and security workflows. This is governance at scale. And happy admins mean happy devs. READ MORE ⤵️
Enterprise repository policies. Manage repository lifecycles with granular governance of repository configurations across your enterprise and its organizations.
Enterprise custom repository properties. Create and manage custom repository properties across your organizations, and promote existing organization properties to the enterprise.
Immutable GitHub Actions. Secure your supply chain with semantically versioned, immutable actions stored in GitHub Packages.
Create custom organization roles. Use repository-level permissions and roles at the organizational-level across all repositories in an organization.
GitHub Apps for your organization. Create enterprise-owned, internal-visibility GitHub Apps for installation across your organizations.
The new GitHub Enterprise Trust Center. Find information on key topics for your enterprise like privacy, security, and data protection all in one place.
More compute resources and better insights for your workflows
No matter what you’re doing, compute power matters—and so do performance and API insights. That’s why we’re introducing new Arm64-powered runners and improving performance tracking across your workflows and CI/CD pipelines on GitHub Actions and API activity on GitHub. READ MORE ⤵️
Arm64 GitHub-hosted runners. Build, test, and deploy on Arm64 GitHub-hosted runners on GitHub Free plans to unify your CI/CD workflow and optimize compute costs. This feature will be released broadly in early 2025.
API insights. Investigate and resolve API rate-limiting of your GitHub integrations via an in-product dashboard with insights to help monitor API activity.
Your multi-model, AI-native developer experience starts today
Thank you for building with GitHub. If there’s one takeaway we want you to leave with, it’s that software development has never been more exciting.
Today we’re giving you choices with AI models from OpenAI, Anthropic, and Google—so you can pick the right tool for the task. This choice is also powering AI-native developer experiences designed to enable new ways of thinking and coding.
With GitHub Copilot Workspace and GitHub Spark, natural language is taking center stage and powering a future where we merge the developer canvas with powerful agents that simplify your workflows and unlock your creativity at scale. This is the innovation we need to foster the next 1 billion developers, and help them continue to accelerate human progress.
To GitHub Universe, happy birthday. 🎉 And to our global developer community, we ❤️ you, and we’ll see you all again next year. Let’s build from here—together.
Want the most recent updates?
Stay informed about the latest in software development by subscribing to the GitHub Changelog.
]]>Thomas Dohmke<![CDATA[Bringing developer choice to Copilot with Anthropic’s Claude 3.5 Sonnet, Google’s Gemini 1.5 Pro, and OpenAI’s o1-preview]]>https://github.blog/?p=808192024-10-29T16:08:30Z2024-10-29T16:08:30ZAt GitHub Universe, we announced Anthropic’s Claude 3.5 Sonnet, Google’s Gemini 1.5 Pro, and OpenAI’s o1-preview and o1-mini are coming to GitHub Copilot—bringing a new level of choice to every developer.
GitHub Copilot has long leveraged different large language models (LLMs) for different use cases. The first public version of Copilot was launched using Codex, an early version of OpenAI GPT-3, specifically fine-tuned for coding tasks. Copilot Chat was launched in 2023 with GPT-3.5 and later GPT-4. Since then, we have updated the base model versions multiple times, using a range from GPT 3.5-turbo to GPT 4o and 4o-mini models for different latency and quality requirements.
In the past year, we experienced a boom in high-quality small and large language models that individually excel at different programming tasks. It is clear the next phase of AI code generation will not only be defined by multi-model functionality, but by multi-model choice. GitHub is committed to its ethos as an open developer platform, and ensuring every developer has the agency to build with the models that work best for them. Today at GitHub Universe, we delivered just that.
We are bringing developer choice to GitHub Copilot with Anthropic’s Claude 3.5 Sonnet, Google’s Gemini 1.5 Pro, and OpenAI’s o1-preview and o1-mini. These new models will be rolling out—first in Copilot Chat, with OpenAI o1-preview and o1-mini available now, Claude 3.5 Sonnet rolling out progressively over the next week, and Google’s Gemini 1.5 Pro in the coming weeks. From Copilot Workspace to multi-file editing to code review, security autofix, and the CLI, we will bring multi-model choice across many of GitHub Copilot’s surface areas and functions soon.
Whether it’s in VS Code or on GitHub.com, individual developers can now decide which models work best for them, while organizations and enterprises have full control over which models they enable for their team. Try multi-model Copilot today.
Anthropic’s Claude 3.5 Sonnet
Anthropic’s new Claude 3.5 Sonnet excels at coding tasks across the entire software development lifecycle—from initial design to bug fixes, maintenance to optimizations. Claude 3.5 Sonnet demonstrates high proficiency with complex and multi-step coding tasks, handling everything from legacy app updates to code refactoring and feature development.
Google’s Gemini 1.5 Pro
The latest Gemini models from Google show high capabilities in coding scenarios. Gemini 1.5 Pro features a two-million-token context window and is natively multi-modal—with the ability to process code, images, audio, video, and text simultaneously. Gemini 1.5 Pro also delivers impressive response times for regular code suggestions, documentation, and explaining code.
OpenAI’s o1-preview and o1-mini
OpenAI o1-preview and o1-mini are part of a new series of AI models equipped with more advanced reasoning capabilities than GPT 4o. During our exploration using o1-preview with GitHub Copilot, we found the model’s reasoning capabilities allow for a deeper understanding of code constraints and edge cases, producing efficient and quality results.
With GitHub Copilot, the developer is in control. Now you can also control which foundational LLM you use, all with a single login and a single subscription. Try multi-model Copilot today.
First glimpse: multi-model choice for GitHub Spark
In pursuit of GitHub’s vision to reach 1 billion developers, today at Universe we introduced GitHub Spark: the AI-native tool to build applications entirely in natural language. Sparks are fully functional micro apps that can integrate AI features and external data sources without requiring any management of cloud resources. Utilizing a creativity feedback loop, users start with an initial prompt, see live previews of their app as it’s built, easily see options for each of their requests, and automatically save versions of each iteration so they can compare versions as they go.
Here’s a first glimpse, or spark 😀, of GitHub Spark.
]]>GitHub Staff<![CDATA[Octoverse: AI leads Python to top language as the number of global developers surges]]>https://github.blog/?p=805502024-10-31T18:10:19Z2024-10-29T16:07:47ZIn this year’s Octoverse report, we study how public and open source activity on GitHub shows how AI is expanding as the global developer community surges in size.
Remember when people said AI would replace developers? Our data tells a different story. As AI rapidly expands, developers are increasingly building AI models into applications and engaging with AI projects on GitHub in large numbers. At the same time, we’re seeing an unprecedented number of developers join GitHub from across the globe, and many of these developers are contributing to open source projects for the first time.
In 2024, Python overtook JavaScript as the most popular language on GitHub, while Jupyter Notebooks skyrocketed—both of which underscore the surge in data science and machine learning on GitHub. We’re also seeing increased interest in AI agents and smaller models that require less computational power, reflecting a shift across the industry as more people focus on new use cases for AI.
Our data also shows a lot more people are joining the global developer community. In the past year, more developers joined GitHub and engaged with open source and public projects (in some cases, empowered by AI). And since tools like GitHub Copilot started going mainstream in early 2023, the number of developers on GitHub has rapidly grown with significant gains in the global south. While we see signals that AI is driving interest in software development, we can’t fully explain the surge in global growth our data reflects (but we’ll keep studying it).
At GitHub, we know the critical role open source plays in bridging early experimentation and widespread adoption. In this year’s Octoverse report, we’ll explore how AI and a rapidly growing global developer community are coming together with compounding results.
We uncover three big trends:
A surge in global generative AI activity. AI is growing and evolving fast, and developers globally are going far beyond code generation with today’s tools and models. While the United States leads in contributions to generative AI projects on GitHub, we see more absolute activity outside the United States. In 2024, there was a 59% surge in the number of contributions to generative AI projects on GitHub and a 98% increase in the number of projects overall—and many of those contributions came from places like India, Germany, Japan, and Singapore.
A rapidly growing number of developers worldwide—especially in Africa, Latin America, and Asia. Notable growth is occurring in India, which is expected to have the world’s largest developer population on GitHub by 2028, as well as across Africa and Latin America. We also see Brazil’s developer community growing fast. Some of this is attributable to students. The GitHub Education program, for instance, has had more than 7 million verified participants. We’ve also seen 100% year-over-year growth among students, teachers, and open source maintainers adopting GitHub Copilot as part of our complimentary access program. This suggests AI isn’t just helping more people learn to write code or build software faster—it’s also attracting and helping more people become developers. First-time open source contributors continue to show wide-scale interest in AI projects. But we aren’t seeing signs that AI has hurt open source with low-quality contributions.
Python is now the most used language on GitHub as global open source activity continues to extend beyond traditional software development. We saw Python emerge for the first time as the most used language on GitHub (more on that later). Python is used heavily across machine learning, data science, scientific computing, hobbyist, and home automation fields among others. The rise in Python usage correlates with large communities of people joining the open source community from across the STEM world rather than the traditional community of software developers. This year, we also saw a 92% spike in usage across Jupyter Notebooks. This could indicate people in data science, AI, machine learning, and academia increasingly use GitHub. Systems programming languages, like Rust, are also on the rise, even as Python, JavaScript, TypeScript, and Java remain the most widely used languages on GitHub.
A global community of developers that’s growing fast
In early 2023, we celebrated reaching 100 million total developers on GitHub—and that number has climbed at a rapid rate since then. In 2024, developers around the world made more than 5.2 billion contributions to more than 518 million open source, public, and private projects.
So, where in the world are GitHub developers most engaged, and where are we seeing the most growth? And as AI allows developers to code in the natural language of their choice, what parts of the world could we expect to see greater growth in? Let’s take a look. 👇
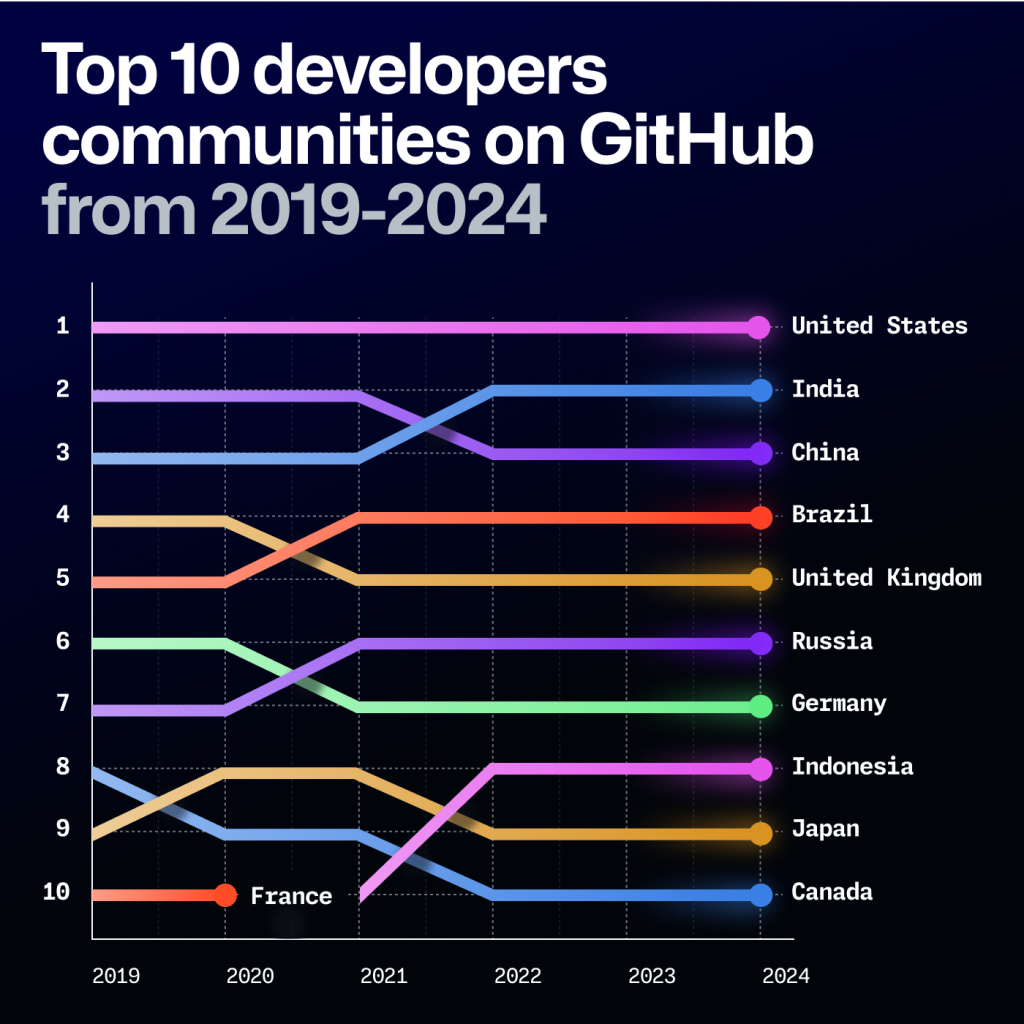
There’s both stability and change among the top 20 countries with the highest number of developers on GitHub. While India continues to approach the number one spot (we now predict by 2028 based on updated projections, but more below), the United States continues to have the most developers worldwide on GitHub. Despite this, we have seen greater growth outside the United States every year since 2013—and that trend has sped up over the past few years.
Globally, we see developer communities growing significantly. Brazil, India, and Nigeria are especially growing fast, which is notable given they are the most populous regions of their respective continents with linguistically diverse populations.
Overall, the top 20 developers communities have largely maintained their positions with a few notable exceptions. These include the Philippines (#18) overtaking Australia (#19) and Pakistan (#20) overtaking Poland (#21).
💡 Stay smart. The rise of these non-English, high-population regions is notable given that it is happening at the same time as the proliferation of generative AI tools, which are increasingly enabling developers to engage with code in their natural language.
Projecting the top 10 developer communities on GitHub through 2030
To identify the developer communities with the highest growth potential over the next five years, we created projections based on current trends. And our prediction from last year changed: India is now on track to surpass the United States in number of developers on GitHub by 2028 (previously, we had predicted it would overtake the United States by 2027 based on linear population growth).
Fastest growing developer communities in Latin America
The tech sector in Latin American countries is currently seeking to “build on [its] … momentum,” as the region experiences rapid growth primarily in open banking, cloud-based infrastructure, and AI. It’s driven by vibrant tech hubs, a large new graduate workforce, and governmental support that includes incentives for tech startups.
“Students learn to collaborate and cooperate, they develop their soft skills. I did a survey at the end of the semester and more than 70% of the students indicated that working on projects through GitHub improved their technical and leadership skills.” – José Alfredo Román Cruz // Professor, Technological Institute of Tlaxiaco
The fastest growing developer communities in Asia Pacific
The number of developers on GitHub in Asia Pacific communities is growing at some of the fastest rates globally—and we expect this trend to continue. This will be particularly true as generative AI increasingly empowers developers to engage with code and communities, regardless of their spoken language.
Singapore has a high developer-to-population ratio, and government-led initiatives drive its tech sector, like its ambition to become a world-leading Smart Nation and its National AI Strategy.
“GitHub is like the air we breathe. It’s such a natural part of the way we work that sometimes we don’t even notice it. We cannot imagine living without GitHub.” – Ryuzo Yamamoto // Software Engineer, Souzoh
The fastest growing developer communities in Europe and the Middle East
Spain’s developer population is rising, securing the 15th largest GitHub user base globally. The country is committed to its plans to advance their national AI strategy by developing Spanish language AI models.
France’s openness towards AI and tech innovation is also demonstrated through the country’s 2030 plan, which includes investments in upskilling and attracting AI talent. Related is its effort to support start-up solutions through its French Tech 2030 program.
Turkey has seen significant growth in its information and communication technologies markets. The country aims to enhance its banking, healthcare, and media sectors with 5G while relying on its local telecom operators to accelerate Internet of Things (IoT) and smart city projects.
The United Arab Emirates is also a region to watch, as it recently committed to becoming a global leader in AI and advanced technology and saw a 32% year-over-year increase in developers on GitHub.
“Basically, everything we build is iterating on open source. I think it’s only reasonable for a larger organization like us to engage and give back to the community where possible.” – Kay Goebel // Engineering Lead, Zalando
The fastest growing developer communities in Africa
Africa is nurturing an increasing pool of developers that is ready to drive the next wave of tech entrepreneurialism—and, in some cases, already are. The continent’s developers have cultivated a thriving open source community with initiatives like Open Source Community Africa and All In Africa.
Country
Percentage growth
# of developers
Nigeria
28% YoY
>1.1M
Egypt
25% YoY
>990K
South Africa
23% YoY
>664K
Morocco
25% YoY
>556K
Kenya
33% YoY
>393K
Nigeria, Egypt, South Africa, and Kenya are considered Africa’s “big four” countries focusing on technical literacy, drawing global investors, and securing most of Africa’s startup funding in 2023. For example, Egypt’s Ministry of Communication and Information Technology is developing technical skills through its “Our Future is Digital” initiative.
“I think it’s important to change the perception that Africans are merely consumers; we are creators as well. By helping people across Africa build projects and showcase their work globally, I hope to change this narrative and demonstrate that Africa is also a hub for innovation and creativity, especially within the open source community.” – Ruth Ikegah // Community Lead, CHAOSS Africa
South Africa also aims to train its young workforce in programming, AI, cloud computing, and robotics.
Morocco’s outsourcing was also cited as “a key sector” in advancing the country’s digital transformation.
The state of open source
In 2024, developers globally made nearly 1 billion contributions to open source and public repositories across GitHub (this includes open source projects with a license and public projects without a license accepted by the Open Source Initiative). These contributions ranged from popular projects like home-assistant/core to generative AI projects like ollama/ollama (more on that later) and commercially backed projects like vercel/next.js.
Similar to last year, we saw commercially backed and generative AI projects attract the most contributions in 2024. But where those contributions came from is notable with regions outside North America and Europe surging in overall activity.
More developers are consuming open source with a 15% spike in JavaScript packages through the npm registry. The top 50 packages saw net positive growth, which signals solidification and maturation of the JavaScript ecosystem. This also suggests that more people consume open source as key ecosystems—as with JavaScript—mature.
We see some differences between the top regions on GitHub and the top regions contributing to open source. For instance, Germany ranks as the third largest region contributing to open source on GitHub—but as of 2024, they are the seventh largest community on GitHub by developer population.
There’s a continued increase in first-time contributors to open source projects. 1.4 million new developers globally joined open source with a majority contributing to commercially backed and generative AI projects. Notably, we did not see a rise in rejected pull requests. This could indicate that quality remains high despite the influx of new contributors.
Top 10 open source and public projects attracting the most first-time contributors in 2024 on GitHub
The top open source projects by contributors on GitHub.home-assistant/core and flutter/flutter continue to rank among the top projects by contributors on GitHub, reflecting their popularity and community strength. Notably, vercel/next.js showed up again in the top 10 list for all contributors, which indicates its continued growth and stature in web development.
ollama/ollama also appeared in the top 10 public and open source projects, with the most contributions outranking large projects such as PyTorch and PowerToys. As of 2024, it’s the third fastest-growing project by contributors on GitHub. This suggests a notable interest among developers in AI models that require less computational power (more on this later).
Notably, the IoT project, koenkk/zigbee2mqtt, also emerged on our list this year—and that’s likely due to the popularity of home-assistant/core, given koenkk/zigbee2mqtt can be used to get data such as room temperature. With Ultimaker/Cura on the list as well, it’s clear that there is a large maker and hacking culture in open source.
One callout: The programming language project, ProvableHQ/leo, which appeared for the first time in our top open source projects by contributors. As a statically typed language, Leo is often used for private applications developed on private, decentralized blockchain technologies.
Developers are driving societal change through popular open source projects. GitHub’s For Good First Issue is a curated list of DPGs that need contributors, connecting those projects with people who want to address a societal challenge and promote sustainable development. As more developers continue to join GitHub globally amid investments in connectivity and AI, we expect continued contribution growth in DPGs.
Top 10 For Good First Issue projects attracting first-time contributors in 2024
More than 82% of GitHub contributions are made to private repositories. Developers made 4.3 billion contributions across more than 181 million private repositories in 2024. These numbers show the sheer scale of activity happening out of view in private repositories through free, Team, and GitHub Enterprise accounts—especially since we started offering private repositories to developers with free accounts in 2019.
A spike in Jupyter Notebooks use shows that open source underscores a growing community, especially as Python surges to become the most used language on GitHub. Since 2018, we have seen the use of Jupyter Notebooks steadily grow—and that growth surged in 2022 as research and experimentation with generative AI and machine learning took off. Since 2022, Jupyter Notebooks usage on GitHub has spiked more than 170%. And since last year, usage has increased by 92%. Data scientists and machine learning researchers commonly use the open source application for machine learning, data visualization, and more.
The state of generative AI in 2024
Over the past year, generative AI has moved beyond the hype of 2023 as developers and organizations alike look for results over experimentation—and data on GitHub shows as much. In 2024, developers on GitHub created over 70,000 new public and open source generative AI projects and made almost 60% more total contributions to all generative AI projects on GitHub.
AI models become part of the developer’s tech stack. We’re seeing innovation in generative AI on GitHub move into public repositories, showing that developers are building more and more in the open. As developers identify more and more use cases for AI, the role of generative AI models in software development has shifted from helping developers write code to a new building block in developing applications.
Yet, there’s a growing need among developers for smaller models with good performance and lower compute costs, driven by a desire for the embedded use of AI models in smartphones.
Notably, the fastest-growing open source AI project in 2024 by contributor count was ollama/ollama, suggesting increased experimentation with locally run LLMs.
As models become smaller and less compute intensive, we expect more developers will use them in applications.
Developers on GitHub are trying to lower the barrier to AI experimentation. The top 10 public generative AI projects work to improve access to AI models to make experimentation easier. Applications range from creating user-friendly interfaces that improve text-to-image generation to building autonomous AI agents for task management. To pull this data, we looked for repositories that use generative AI-related keywords collected from our research last year.
Top 10 public generative AI projects in 2023 vs. 2024
A rise in smaller scale models. In the last year, developers on GitHub have worked with Meta’s LLaMA models, which suggests a growing interest in smaller, open source models.
We also see via projects like binary-husky/gpt_academic a growing interest in developing AI tools for specialized use cases such as academic research.
A continued focus on developing AI agents to automate processes. The continued presence of AutoGPT-related projects indicates that automation remains a significant area of exploration, with developers focusing on enhancing the capabilities of AI agents.
More than one million open source maintainers, and verified students and teachers have used GitHub Copilot at no cost. In 2024, we saw a 100% increase in teachers, students, and open source maintainers using GitHub Copilot in our complimentary program. This underscores AI’s utility in education and upskilling (like learning a new programming language). In the last year, over 450,000 GitHub Education users were first-time contributors to projects on the platform.
We see a correlation in increased activity among developers who regularly use GitHub since the launch of GitHub Copilot. Among developers who use GitHub regularly and use GitHub Copilot, we see higher activity (between 12-15% among developers who use GitHub five days a week and 8-15% among developers who use GitHub once a week) across open source and public projects. This echoes research conducted into AI coding tools’ impact on overall perceived and quantitative productivity gains among developers.
We are already seeing growth in global contributions and contributors to generative AI projects. Developers in the United States, Hong Kong SAR, India, Germany, and France are among the top groups driving contributions to generative AI projects. India, for instance, had a 95% increase in year-over-year contributions to generative AI projects on GitHub while France had a 70% increase. These communities also saw some of the largest year-over-year growth in contributors.
Other communities saw some of the highest percentage growth in contributors to public generative AI projects, like the Netherlands (291%), Ethiopia (242%), Costa Rica (171%), Serbia (175%), and Vietnam (143%).
These communities have fewer total contributors, causing any growth to result in a high percentage rate—but their growth still shows the global community of developers collaborating on generative AI projects.
We anticipate this growth will continue, especially as more small language models are introduced in the broader marketplace, reducing computational requirements around developing software with AI. Moreover, as generative AI coding tools enable developers to write code with natural language, we see more opportunities for developers globally to contribute to projects, regardless of their native language.
💡 Stay smart. When comparing regions with a high number of generative AI contributors versus regions with a high number of contributions, we see that while growth is still happening globally, the regions with larger developer populations are rising to the top.
The state of security and automation in 2024
In 2024, developers across GitHub used secret scanning to detect more than 39 million secret leaks. We also saw developers and open-source communities respond more quickly to security incidents through new generative AI security tools, automated alerts, and proactive measures. This isn’t just helping make software more secure—it’s leading to faster fixes, too.
The most common security vulnerabilities in 2024.Injection, an admittedly large category of security issues, was the most common type of vulnerability found across public and private repositories via CodeQL, a code analysis engine developed by GitHub to automate security checks. Meanwhile, Security Logging and Monitoring Failures vulnerabilities were found more often in private repositories.
Developers are increasingly using AI for code reviews and security vulnerability remediation. AI doesn’t replace security experts, but it can augment their knowledge and capabilities while helping address a global shortage of security professionals.
Notably, developers are experimenting with AI tools like Copilot Autofix, an AI-powered security tool that automatically detects vulnerabilities and suggests fixes while offering explanations in natural language.
We expect tools like this to improve security across open source and public projects—as well as with closed source, too. So far with Copilot Autofix, we’ve seen it helps developers:
Fix code vulnerabilities more than three times faster than those who did so manually, reducing time to fix for a pull request-time alert from 1.5 hours to 28 minutes.
Fix cross-site scripting vulnerabilities seven times faster, reducing time to fix to 22 minutes, compared to almost three hours.
Fix SQL injection vulnerabilities twelve times faster, cutting time to fix to just 18 minutes, compared to 3.7 hours.
Developers on GitHub are using automation to manage increasing security responsibilities. For instance, developers are merging an increasing number of pull requests generated by Dependabot, which sends alerts about outdated or vulnerable dependencies in a pull request. The gap between pull requests opened by Dependabot and pull requests merged by developers continues to shrink year over year, too.
While developers are using automation and AI to secure their code and applications, there’s room to improve. Government regulations increasingly demand developers know the ingredients going into their software artifacts, which increases demand for implementing tools that automate governance and compliance.
94% of the top 50 open source projects are using the OpenSSF Scorecard to help ensure their projects implement security best practices. We evaluated this by looking at roughly 1 million repositories that have OpenSSF scorecards in place from the top 50 most popular open source projects. The OpenSSF Scorecard action assesses repositories, runs checks for security best practices, and generates a security scorecard with real-time feedback.
Becoming familiar with GitHub security features, such as code scanning and secret scanning (which are free for open source developers), and supply chain governance features like artifact attestations is a good first step towards automating best security practices. Enterprise developers can also turn to their OSPOs for support in navigating regulations and implementing security measures across their open source dependencies, as OSPOs will play increasingly critical roles in compliance.
Developers are increasingly automating more aspects of build, test, and security activities using GitHub Actions in public and open source projects. In 2024, we saw developers use 10.54 billion total GitHub Actions minutes (measured in CPU minutes). That’s up almost 30% year over year from the 7.3 billion GitHub Actions minutes developers used in 2023.
“We get everything we need from the GitHub Actions marketplace to build and support our tailored CI/CD pipeline.” – Bjoern Bengelsdorf // Senior Software Engineer, Otto Group
Among the most popular GitHub Actions in the GitHub Marketplace are OpenCommit, which augments commit messages with meaningful AI-generated content when pushing to remote, and Replexica, which provides AI-powered code translations across multiple programming languages. These actions suggest that developers are finding more use cases for generative AI in their workflows.
Python becomes the most used language on GitHub, overtaking JavaScript after a 10-year run as the most used language. This is the first large-scale change we’ve seen in the top two languages since 2019—and it speaks to the rise in Python that’s accompanied the generative AI boom we’ve seen over the past two years.
What the Python Software Foundation says: We reached out to the Python Software Foundation, and Deb Nicholson, the foundation’s executive director, gave us the following response, “Our goal is for Python to be a great tool that helps the ever-growing developer community build the world they envision. We couldn’t be more pleased to learn about Python’s continued rise in popularity on GitHub, especially coupled with the increased use of Jupyter Notebooks, data analysis, AI, and open source technology.”
What else we’re seeing: Shell also overtook C in 2024. Though languages like Rust and Go are on the rise, more conventional languages are still heavily used and in demand. Additionally, high adoption of beginner-friendly languages like JavaScript and Python raises the possibility of more people learning how to code, as these are popular languages in settings like academia and data science.
Notably, JavaScript still ranks first for code pushes alone. More developers still use JavaScript more often to push code, but in absolute activity across all contribution types on GitHub, Python now outranks JavaScript. In addition to Python’s relative ease, it is also a popular choice for data science and generative AI—both of which have grown sharply on GitHub over the past two years.
TypeScript is cutting into JavaScript. After growing exponentially from 2014-2019, TypeScript overtook Java last year to enter the top three programming languages on GitHub—and its continued growth speaks to its utility as a language, type checker, and compiler all in one. While Python is increasing in contributor counts for both code push activity alone and other activity faster than JavaScript, it isn’t increasing in those faster than JavaScript and TypeScript combined. Rather than a slow down in the JavaScript community, what we are seeing is a transition to TypeScript for a large proportion of new commits. TypeScript is a superset of JavaScript and in the same npm ecosystem as JavaScript which makes it simple for JavaScript developers to gradually adopt.
JavaScript still maintains a massive developer base as we see increases in npm package consumption. The language is versatile in running on both client and server sides, and easily adapts to different frameworks and standards, among other reasons for its popularity. And as its robust ecosystem continues to mature, we’re seeing strong growth in the consumption of packages via the npm registry with a 15% year-over-year increase.
Rust continues to gain popularity for its safety, performance, and productivity. Originally intended to serve as a safer alternative to C and C++, Rust has exploded in popularity and adoption, with top applications, such as Microsoft Windows, using Rust to rewrite core libraries with its memory-safe code.
Based on emerging and top languages, the notion of a developer extends beyond software developers to roles like operations or IT developers, machine learning researchers, data scientists, students, teachers, and mathematicians.
Python is the top preferred language for data science and research, and its continued growth over the past few years—alongside that of Jupyter Notebooks—may suggest that activity on GitHub is going beyond traditional software development.
T-SQL, an extension of SQL that’s primarily used within Microsoft SQL server, also indicates activity among data scientists and database administrators.
The continued popularity of HCL and Go reflect growth in operations and IaC work, particularly around managing cloud-native infrastructure. Since we first saw massive growth in cloud-native development in 2019, IaC has continued to grow in open source. The 25% year-over-year growth of HCL in particular suggests developers increasingly use declarative languages to dictate how they’re managing cloud deployments.
The popularity of HCL and Go as well as Dockerfiles suggest that developers are scaling work in cloud-native applications. Increased Terraform use follows the increased use we’ve seen in Dockerfiles and other cloud-native technologies over the last decade. The increased adoption of IaC practices also suggests developers are bringing more standardization to cloud deployments.
Take this with you
As the developer’s tech stack evolves, so does their role over time. We leave you with three takeaways:
Generative AI models are becoming core building blocks in software development. They power coding tools that offer fixes and context behind vulnerability remediations, suggestions in response to natural language prompts and existing code, and facilitate learning among new and experienced developers alike. They’re also changing how developers build applications, and developers will benefit from platforms that allow them to easily experiment with AI models as building blocks without requiring separate setups or extra costs.
The global community of developers on GitHub is expanding rapidly—and the next generation of developers is getting started on GitHub. An increasingly diverse community of developers drives innovation and talent, and refreshes the pool of solutions to increasingly complex problems. Increased access to and experimentation with AI could also simplify and personalize the coding journey for new developers, lowering entry barriers and further diversifying GitHub’s community of developers.
The notion of who a developer is and the scope of what a developer does is changing. The rise in Python, HCL, and Jupyter Notebooks, among other things indicates that the notion of a developer extends beyond software developers to roles like operations or IT developers, machine learning researchers, and data scientists.
Glossary
2024: Refers to October 1, 2023 through September 30, 2024.
Contributions: Commenting on a commit, issue, pull request, pull request diff, or team discussion; creating a gist, issue, pull request, or team discussion; pushing commits to a project; and reviewing a pull request.
Contributors: GitHub users who have performed any of the contribution activities defined above
Developer: Anyone with a GitHub account. Also sometimes referred to as a GitHub user. The open source and developer communities are an increasingly diverse and global group of people who tinker with code, make non-code contributions, conduct scientific research, and more. GitHub users drive open source innovation, and they work across industries—from software development to data analysis and design.
Generative AI: To find generative AI projects, we sourced a list of topic strings from GitHub CEO Thomas Dohmke’s white paper with Keystone and searched for projects tagged with at least one of those topics.
GitHub Classroom users: Anyone who has logged into GitHub Classroom. All GitHub Classroom users are GitHub Education users, but not all education users are classroom users.
GitHub Education user: Includes GitHub Classroom users, couponed users (students, teachers), and users affiliated with an education organization.
Methodology
This report draws on anonymized user and product data taken from GitHub from October 1, 2023 through September 30, 2024.
More data is publicly available on the GitHub Innovation Graph—a research tool GitHub offers for organizations and individuals curious about the state of software development across GitHub. Only public activity is included, and metrics for economies are only reported when there are 100 or more unique developers performing the relevant activity within the time period.
]]>Kevin Stubbings<![CDATA[Attacking browser extensions]]>https://github.blog/?p=806842024-10-24T18:15:02Z2024-10-24T18:15:02ZLearn about browser extension security and secure your extensions with the help of CodeQL.
Browser extensions first became mainstream in the early 2000s with their adoption by Firefox and Chromium and their popularity has been growing ever since. Nowadays, it is common for even the average user to have at least one extension installed, often an adblocker. Research into the security of browser extensions is mostly scattered around between individual bug reports and coverage on malicious chrome extensions. In this blog, I will introduce the structure of a browser extension and the vulnerabilities that are present in the ecosystem. I will then discuss the progression of security in the extension space, highlighting the attack surface and its relationship with mitigations that have been implemented. Lastly, I will recommend some CodeQL queries and best practices that users, developers and researchers can use to ensure the security of their extension.
The extension structure
Mozilla and Google, and their respective browsers, Firefox and Chromium, set the standard for most browser extensions (note, we will not cover Apple’s Safari here). Throughout this blog, I will talk about extension core concepts, and highlight the differences between Firefox and Chromium. The differences between Firefox and Chromium are manifested in the differences in policy on what is allowed on the corresponding extension stores and how extensions interact with the browser, which ultimately decide the security and safety of extension for the end user.
A browser extension is a group of HTML, CSS, and JavaScript files that work together to enhance the browsing experience. Usually, the code runs in its own domain, the domain labeled by the extensions ID. For example, the Chromium extension uBlock origin https://chromewebstore.google.com/detail/ublock-origin/cjpalhdlnbpafiamejdnhcphjbkeiagm will run in the domain cjpalhdlnbpafiamejdnhcphjbkeiagm, which the Chromium web store makes obvious via the URL. Extension URLs vary depending on the browser, but generally follow the pattern: browser_specific_extension_scheme://extension_id/actual_resource_name. If you want to access the popup present on uBlock origin Chromium extension, you can use the URL: chrome-extension://cjpalhdlnbpafiamejdnhcphjbkeiagm/popup-fenix.html.
Besides the HTML, CSS and JavaScript files, an extension also has one important settings file, named manifest.json. This is a required file that lists the identification of the extension, permissions required of the extension, and the accessibility of the extension. As the ecosystem of browsers have progressed, the version of the manifest.json has also progressed, with new versions often enforcing more secure settings and making changes to the nomenclature. In the next section, we will discuss the contexts an extension’s files can run in and how this can be directed via the manifest file.
In the manifest.json file, we can specify the context that a file will run. The three major contexts are the webpage/content script, the popup and the background. You can let the browser know which context you want the file to run in by specifying it in the manifest.json file, aptly labeled content_scripts, background_script, and browser_action in the manifest version 2 (v2). On manifest version 3 (v3), a manifest.json may look like the following:
Here, you can see how the v2 permissions have changed slightly to their v3 counterparts: content_scripts, background and action, showing the minor changes between versions.
Background script and permissions
Let’s start by talking about the background context. The background context is the most powerful of the three contexts with the ability to access most of the browser extension APIs/WebExtensions API. From now on, I will refer to both browser extension APIs and WebExtensions API as the Extension APIs for the sake of brevity. The Extension APIs give an extension a lot of control of the user’s browsing experience, with the ability to arbitrarily control tabs, read from the websites, or modify and read cookies, to name a few. Luckily, these abilities are each locked behind permissions, requested in the manifest.json file under the “permissions” key. When installing an extension, a popup will show up describing in a user friendly way which permissions an extension will be granted.
There are some important permissions to look out for during a security review of an extension. Firstly, look for the permissions key in manifest.json, whose values are a combination of hosts and actual permissions in manifest version 2.
In this example, the extension can access all URLs, which can be specified through regex or through the keyword all_urls. When an extension has permissions for a domain, it will allow the extension to send requests to the domain with all cookies, ignoring some security considerations. For example, if the website puts some SameSite strict cookies in the browser, the extension can still make requests on your behalf with those cookies despite being part of a separate domain. In v3, domain permissions are moved to host_permissions and additional optional permissions are introduced, which are requested during runtime based on user consent. A v3 manifest may look like:
Some important permissions to look for are those that include user sensitive information, such as history, bookmarks, cookies or permissions or ones that give the extension more control over the browser, such as downloads, management, or tab. One permission that has a lot of power is the activeTab permission, allowing the extension to inject JavaScript code into any domain that the user is currently interacting with. In order to inject into the current tab, it must have user interaction. This activeTab is interesting for exploitation and malicious extensions alike due to its immense power. If malicious input can be injected into the executed JavaScript, the attacker may get the ability to get Universal XSS (UXSS). A malicious extension, on the other hand, can create shortcuts that overlap with common user actions, such as copy or paste, and interact with tabs it is not supposed to have access to. The permissions of an extension are a great way to start assessing an extension to see if it even has enough privileges to perform actions that may pose a risk. The background script should be audited to ensure the safety of calls to the browser APIs, and analyzed to see how messages are sent back to the content scripts.
Content scripts
The frontend of an extension is just as important as the backend when extensions want to interact with the DOM of the pages visited by the user, a responsibility that a background script cannot achieve due to its lack of access to the DOM. This is where content scripts come into play. The content script runs in the context of the website but lives in an isolated world, where “JavaScript variables in an extension’s content scripts are not visible to the host page or other extensions’ content scripts.” For example, if an extension wanted to add the summary of a page to the top to help readability, the code may look something like this.
The content script may also listen for user interaction on the current page, allowing an action to be taken based on the user interaction. For example, some extensions translate text present on the current page, based on the user’s highlight or focus on a certain word or phrase. The content script and background script work in harmony in order to create the extension’s intended experience.
Popup context
Lastly, the popup context is present for the HTML and JavaScript that makes up the menu that “pops up” when you click on the icon of the extension. Often, the popup will let the user directly interact with the functionality of the extension, usually allowing them to change settings and make requests to backend servers that are tied to the extension.
For example, in the uBlock origin popup, we can click on different icons to access the options page, disable fonts and JavaScript, or disable the extension on the current website.
The popup page, along with the other HTML pages included in the extension, can be a critical source of interest. For example, MetaMask is a crypto wallet extension. If a website can cover the extension, a malicious website can trick the user into signing transactions and thus result in the loss of funds.
Like the background script, the JavaScript running in the popup page can use all the Extensions APIs that the extension has permissions for and any JavaScript runs in the domain of the extension.
Attack surface
Because browser extensions are made from HTML, CSS, and JavaScript, they are vulnerable to many of the classic JavaScript vulnerabilities. I will first introduce the attack surface of v2 extensions because it is a superset of v3, then I will conclude by talking about the mitigations brought about in v3 and how it restricts the attacker. I will also write about browser specific implementations and how they affect security.
All attacks must start from an attacker-controlled source, and the extension interacts with two main attacker-controlled sources:
A website loaded by the user
Other installed extensions
The most common attack surface in the content script occurs when data is parsed from the current website and the script injects the data into the document as HTML. Some extensions extract the DOM text and attempt to make changes, often to beautify the text or to use the data in some way, then return the DOM text back to the webpage. If the extension allows the text to be inserted back into the page as HTML, we can get an XSS vulnerability in the website. However, this has the prerequisite that the extracted DOM text is controlled by an attacker. Common cases may include when a user comments on a website, or on websites that allow user uploaded content like many social media sites.
Secondly, an extension can interact with another extension by calling the sendMessage API to send a message and onConnectExternal/onMessageExternal APIs to receive a message. If the extension does not check the sender, a malicious extension may be able to access any functionality that the onMessageExternal/onConnectExternal function facilitates.
Depending on the configuration of the manifest, new vulnerabilities can be introduced. Let’s see some of those.
The external_connectable property allows an extension to be connected to by a given website or extension ID. Here we can see how onMessageExternal/onConnectExternal can be extremely dangerous if there is a misconfiguration, as the functionality that was only meant for other extensions is now available to websites.
Another interesting configuration property is the web_accessible_resources:
This property opens up an extension up to a greater attack surface by introducing two new possible attack vectors. If an HTML file is web accessible, then a website can load the HTML file in an iframe. If the page takes URL parameters and uses them in any privileged way, a malicious website may be able to make privileged actions. Secondly, if the HTML page allows for sensitive actions and is web accessible a clickjacking vulnerability is possible, where the website will cover the iframe and get the user to input or click on privileged operations. More information on clickjacking can be found on this great blog post showing an attack on Privacy Badger.
Thus, our three attack surfaces boil down to:
The extension takes attacker-supplied input from the website and uses it in some unsafe way.
Another extension or a website sends a message to the extension and the extension uses that input in a dangerous way.
The extension takes in URL parameters when it is loaded, and those parameters are used to do a privileged operation. This requires a vulnerable configuration.
A quick assessment of all these vulnerabilities shows us why browser extensions are generally pretty secure, because it often requires multiple points of failure in order to introduce an exploitable vulnerability. Often, a misconfiguration is needed alongside a vulnerability in order to make the vulnerability truly exploitable.
Next, we will take a look at the possible vulnerabilities that occur in a browser extension, and the mitigations that browser developers have developed to mitigate these issues.
Vulnerabilities
Cross-site scripting
Cross-site scripting vulnerabilities are present across many web applications, and are present in browser extensions as well. XSS can occur in two contexts, in the context of the content script and in the context of the background script. An XSS gives the attacker the same privileges as the running JavaScript, therefore an XSS in the context of the content script allows the attacker to compromise the user on that specific website. In contrast, an XSS in the context of the background script allows the attacker to call any Extension API the extension has permissions for, and thus gives the attacker much more control over the entire browser (for example, UXSS).
In order to talk about XSS, we must talk about the Content Security Policy (CSP). On manifest v2 and v3 of extensions, the unsafe-inline directive is not allowed in the extension. Therefore, any HTML pages that are part of the extension such as the popup, the options page or any other, are immune from XSS. They are, however, still vulnerable to HTML injection attacks. However, the unsafe-eval attribute is still allowed on manifest v2 but has since been deprecated in manifest v3. When looking for XSS vulnerabilities in extensions, check if the manifest contains the unsafe-eval directive.
Then, look for functions that execute code such as eval(), Function(), setTimeout(), setInterval(), etc. Another function to look out for is the Extension API function executeScript. On manifest v2, the API is tabs.executeScript() and allows taking in a string as code, so it is just like the eval() function. Manifest v3 has removed this API, introducing a new API called scripting.executeScript() which only allows local files to be executed. Generally speaking, outdated Firefox extensions are much more likely to be vulnerable to XSS, as Firefox AddOn Store is still accepting new manifest v2 extensions and thus has access to unsafe-eval directive and the tabs.executeScript() API. Many actively developed extensions even have a Firefox v2 and Chromium v3 extension, due to Google’s push for the new version. I want to shout out this article by Wladimir Palant, which goes into detail about the possible vulnerabilities that occur when using old versions of jQuery and unsafe-eval, and shows some code demonstrating the attacks.
SSRF
Server-Side request forgery is a common vulnerability found in web applications, and we can also find them in browser extensions. Browser extensions are similar to web applications, but run with the cookies of a client-side browser. If an attacker is able to influence the URL of a network request such as XMLHTTPRequest or fetch, it is possible that an SSRF can result. The effect of the SSRF will depend on the specified method, whether the extension developer makes the request with credentials/cookies, and whether the manifest of the extension has that website allowed in the permissions/host_permissions entry.
In its move from v2 to v3, changes to an extension’s ability to make requests have been implemented. Specifically on manifest v2 and on Firefox, an extension with no permissions is able to send requests to arbitrary domains with cookies, but is not able to send SameSite cookies, which is reserved for those with the correct permissions. In Chromium, an extension with no permissions cannot send requests with cookies. In contrast, v3 extensions require the host_permissions in order to send any cookies with the request. This means that SSRF with v2 in Firefox is much more powerful than with v3, depending on the security of the website you are targeting. This, along with Firefox’s lack of enforcement for new extensions to be v3 in the addons store, makes Firefox extensions more vulnerable to SSRF attacks than Chromium.
Extension API injection
Injection into the Extension APIs is a vulnerability unique to browser extensions. If attacker-controlled data is able to be injected into an API call, an attacker may gain the abilities of the extension. Generally, the APIs fall into two categories, those that change data and those that leak data. Some of the APIs that allow you to change data include downloads.download(), the bookmark create or remove function, and even the cookies set function. Unsurprisingly, these APIs are made with safe defaults present. The download method can only download to the user-defined Downloads folder, and is sanitized from path traversal and the like.
Another example would be tabs.update(). If you go into your browser’s bar and type in javascript:alert(document.domain)while accessing a website, you should get an alert showing the website’s domain. A XSS used to be possible using tabs.update() by doing this exact action programmatically, which has since been patched. Most API Injection attacks lead to DOS attacks or information loss, where an attacker can download an infinite number of files until the disk is full, or create/remove bookmarks to annoy the user, but are not as powerful as the traditional web application primitives.
Mitigations
I have discussed many mitigations that have come from the transition from v2 to v3 in the respective vulnerability categories above, but I would like to highlight one browser-specific mitigation below.
UUID randomization
Now that we understand the attack surface and some common vulnerabilities, we can see what mitigations browser developers have put in place to prevent vulnerabilities. Firstly, many browsers have randomized the ID of the extension, so that attacking exposed HTML files is no longer a threat, unless a leak of the internal ID, called the UUID, can be found.
Here, we can see that all files, such as the manifest, are relative to the Internal UUID. Content scripts can still access the pages by calling browser.runtime.getURL, but this is not possible from within the page itself due to this change. From my testing, both Firefox and Safari randomize this UUID by default, while Chromium does not (at the time of writing this blog). Firefox randomizes based on the container and Safari on application restart. Despite claims both in Chromium and MDN docs that the Chromium browser will randomize the UUID if given the key use_dynamic_url in the manifest being in the docs for many years, this feature was only implemented and enabled by default in August 2024.
Modeling with CodeQL
Just like many web application vulnerabilities, vulnerabilities in browser extensions can be modeled in CodeQL. CodeQL already has support for many of the vulnerabilities, such as XSS and SSRF, which we can use as the base for our queries. CodeQL’s code injection query gets a RemoteFlowSource (any Javascript APIs that potentially take in data from an external system or user) and looks for flow into Javascript code injection sinks such as eval. These sinks are relevant for browser extensions, but more sinks applicable only to browsers exist. We can create a module of sinks that would apply to browser extensions and extend the Code Injection query’s Sink class to tell CodeQL to consider these sinks.
/**
* Sink for chrome.tabs.executeScript() which may allow an allow arbitrary   * javascript execution.
**/
class ExecuteScript extends DataFlow::Node {
  ExecuteScript() { exists( DataFlow::CallNode c |
    c = tabsRef().getAMethodCall("executeScript") | (this = c.getArgument(0) and c.getNumArgument() = 1)
    or
    (this = c.getArgument(1) and c.getNumArgument() = 2 ) )}
}
Here, we get a dataflow node that corresponds to browser.tabs and look for the executeScript method. If the method is called with one argument, then it looks for the only argument, but if it has two arguments then the method looks for the second argument, because the first argument is the tabID.
When CodeQL is trying to find vulnerabilities in source code, it needs to know how data flows if an external API is called whose implementation is not given. The Chrome APIs sources are not included in a browser extension, therefore we need to model how the foreground script communicates with the background script.
class BrowserStep extends DataFlow::SharedFlowStep {
    override predicate step(DataFlow::Node pred, DataFlow::Node succ) {
      (exists (DataFlow::ParameterNode p |
        pred instanceof BrowserAPI::SendMessage and
        succ = p and
           p.getParameter() instanceof BrowserAPI::AddListener
      ))
    }
  }

  class ReturnStep extends DataFlow::SharedFlowStep {
    override predicate step(DataFlow::Node pred, DataFlow::Node succ) {
      (exists (DataFlow::ParameterNode p |
        succ instanceof BrowserAPI::SendMessageReturnValue and
        pred = p.getAnInvocation().getArgument(0) and
           p.getParameter() instanceof BrowserAPI::AddListenerReturn
      ))
    }
  }
In Javascript CodeQL, we can extend the SharedFlowStep class in order to tell CodeQL that data flows between two data flow nodes. In this first class, I tell CodeQL that data travels between parameter one of sendMessage in the foreground script to the third parameter of the AddListener method in the background script, all in one step. Likewise, the second class models the background script sending a message to the foreground script. With these models in place, we are able to use the Code Injection and CSRF queries to help find XSS and SSRF in browser extensions. CodeQL packs with support for browser extensions are available at our Community Pack repository for developers and researchers to use.
Real-world attack
In this example, I will show how these CodeQL models found a Universal XSS (UXSS) vulnerability in smartup, an extension that has over 100,000 downloads.
Smartup is an extension that allows users to do an action in the browser after a gesture has been taken by the user. The extensions takes untrusted input via onMessageExternal, does a variety of parsing on the message, and eventually processes the message. In one case, apps_test, the extensions uses the chrome.tabs.executeScript v2 API and appends the message property apptype to the code, resulting in XSS. Due to smartup’s broad permission policy (access to all urls or activeTab) and its permissive message receiving policy (arbitrary browser extensions can send it messages), an extension downloaded by the user with no permissions can get UXSS on any website.
chrome.runtime.onMessageExternal.addListener(function(message,sender,sendResponse){
    sub.funOnMessage(message,sender,sendResponse);
})
...
case"apps_test":
    let _fun=function(){
        if(message.appjs){
            chrome.tabs.executeScript({code:"sue.apps['"+message.apptype+"'].initUI();",runAt:"document_start"});      <----- message is passed into executeScript
            return;
        }
This vulnerability may seem serious, but it required three points of failure by the developer (broad permissions, open messaging policy and code injection vulnerability) in order to be fully exploitable. Efforts to inform developers about the importance of security and the risks they take when changing secure defaults should help reduce similar security issues.
Conclusion
Now that you know the security model of browser extensions, what can you do as a user to ensure that your extensions are secure? First, check the author of your extension and understand that this user has access to all the permissions listed when you install the extensions. Extensions that have not been updated in a while by the author are more likely to be insecure due to usage of old, insecure APIs. Secondly, don’t trust the prompt that pops up when installing an extension, instead open the manifest file and read the permissions to make sure you really understand what is happening. For example, did you know the popup for an extension with the activeTab permission will not show the presence of the activeTab permission? Understand that, generally speaking, Firefox is less secure due to the lack of requirement for new extensions to have manifest v3, and thus many Firefox extensions are still stuck on v2. If you would like to go further, you can also check the CodeQL queries published at our CodeQL community packs. in order to check for vulnerabilities. The queries will cover all the vulnerabilities mentioned in this article such as XSS, SSRF, API Injection and include additional best practices alerts.
Want to learn more about how GitHub can take the stress out of shipping secure code?
At GitHub Universe 2024, we’ll explore cutting-edge research and best practices in developer-first security—so you can keep your code secure with tools you already know and love.
]]>Brandon Szymanski<![CDATA[Cybersecurity spotlight on bug bounty researcher @adrianoapj]]>https://github.blog/?p=806792024-10-23T17:52:53Z2024-10-24T16:00:27ZAs we wrap up Cybersecurity Awareness Month, the GitHub Bug Bounty team is excited to feature another spotlight on a talented security researcher who participates in the GitHub Security Bug Bounty Program—@adrianoapj!
]]>As we wrap up Cybersecurity Awareness Month, the GitHub Bug Bounty team is excited to spotlight one of the top performing security researchers who participates in the GitHub Security Bug Bounty Program—@adrianoapj! And don’t miss our previous post highlighting @imrerad.
As home to over 100 million developers and 420 million repositories, GitHub maintains a strong dedication to ensuring the security and reliability of the code that powers daily development activities. The GitHub Bug Bounty Program continues to play a pivotal role in advancing the security of the software ecosystem, empowering developers to create and build confidently on our platform and with our products. We firmly believe that the foundation of a successful bug bounty program is built on collaboration with skilled security researchers.
As we continue to celebrate an amazing 10 years of the GitHub Security Bug Bounty program, we are also looking towards the future. As such, we are looking at ways to better engage with the research community to advance the security landscape. We remain excited about opportunities to meet people and give back to the security community. We love learning new things from our researchers that help us ship even more secure products, and we are always eager to make sure that our products are the best in class. As we look forward, we are truly thrilled and excited about what our future together holds.
As we conclude Cybersecurity Awareness Month, we’re interviewing one of the top contributing researchers to our bug bounty program. Follow along to learn more about their methodology, techniques, and experiences hacking on GitHub. @adrianoapj specializes in information disclosures and has submitted many interesting and unique issues.
How did you get involved with Bug Bounty? What has kept you coming back to it?
Long before getting started with bug bounty, I was already in tech for some years. I got into Bug Bounty when I first learned about it from a Brazilian cybersecurity YouTube channel and then I started to do some capture the flag exercises (CTFs) and watched videos from Hacker101, which helped me a lot to get all the knowledge that I needed to get started. The GitHub Bug Bounty program was the first program that I started to hack on and is currently the program where I send most of my reports.
Something that kept me really motivated at the start of my journey was the defense-in-depth class of bugs at GitHub’s program. In short, the first vulnerability that I reported to GitHub had a really low severity, but GitHub still decided to reward it with a bonus as a reward for the effort. Currently, what motivates me to keep hunting is the challenge of finding bugs, the visible impact of the issues that I find and report, and of course, the bounties!
What do you enjoy doing when you aren’t hacking?
Most of the time that I’m not searching for bugs I am actually working as a full-time Infosec analyst. But in my free time, I like going out with some friends from church and playing video games. This year I also started running, so that’s something that I like to do to relieve some stress.
How do you keep up with and learn about vulnerability trends?
Mostly, I read write-ups and public bug reports that have been disclosed on HackerOne. I am also a big fan of HackTheBox and HackTheBox Academy, where I go to learn new classes of bugs, challenge myself to improve techniques, and get new ideas to test on bug bounty programs.
What are your favorite classes of bugs to research and why?
My favorite class of bugs to research is information disclosure because they normally present a significant impact and they are easy to spot sometimes.
You’ve found some complex and significant bugs in your work. Can you talk a bit about your process?
I usually start by choosing the feature or website that I’m going to test. GitHub Stars was one of the first GitHub websites I ever tested. I’d learned about it from a post on X and decided it would be a good target since it was a new project and there likely wouldn’t be a lot of people searching it for bugs. I was right as I found a lot of great vulnerabilities there. I also like to look at the GitHub Changelog so I can test new features or changes, which are a great place to start for finding bugs, in my experience.
For my process, I rarely use automated tools. Instead, I start learning everything I can about the specific feature or project that I am searching for bugs. After getting a deep understanding about it, I write some possibilities and/or assumptions about what entry points for vulnerabilities could be. Then, I start to test these possibilities, and I’m either able to find bugs or I iterate and think about new tests, until I find something.
Do you have any advice or recommended resources for researchers looking to get involved with Bug Bounty?
Yes! I would say that perseverance is really necessary for researchers, especially when you are starting to get into Bug Bounty. Sometimes, researching for bugs can be frustrating, especially when you are dealing with duplicate or informative reports, or end up going down rabbit holes. But it’s important to know that every service is subject to bugs, and when you keep searching for them, sometimes you find something!
I have some recommendations for learning the necessary knowledge for Bug Bounty:
Hacker101 (for people that are starting to learn about cybersecurity and Bug Bounty).
HackTheBox and HackTheBox Academy (to everyone looking to improve skills and test knowledge on offensive cybersecurity).
Write-ups in general, including blog or X posts, and public reports available on HackerOne.
Do you have any social media platforms you’d like to share with our readers?
Thank you, @adrianoapj, for participating in GitHub’s bug bounty researcher spotlight! Each submission to our bug bounty program is a chance to make GitHub, our products, and our customers more secure, and we continue to welcome and appreciate collaboration with the security research community. So, if this inspired you to go hunting for bugs, feel free to report your findings through HackerOne.
Interested in helping us secure GitHub products and services? Check out our open roles!
]]>Justin Thenutai<![CDATA[Diversity, inclusion, and belonging at GitHub in 2024]]>https://github.blog/?p=806372024-10-23T15:03:43Z2024-10-23T15:03:43ZFrom advancing ethical AI practices to expanding open source learning for developers in Africa, discover how we’ve fostered diversity, inclusion, and belonging this year.
At GitHub, diversity isn’t just a metric we track—it’s the fuel that powers our innovation.
With a goal to be the home of one billion developers, we remain committed to creating an inclusive environment where every voice is heard and every background is valued. In 2024, our Diversity, Inclusion, and Belonging (DI&B) strategy remained robust, as we supported the diversity of both our employees and the greater developer community.
This blog highlights our ongoing efforts and progress this past year, as we strive to build a more equitable company and tech industry. Together, we can create a future where everyone has the opportunity to contribute, collaborate, and thrive.
Talent, tools, and transformation
Over the past year, we’ve maintained our commitment to a diverse workforce. In the U.S., there was a steady increase in our U.S. Asian population of +1.0 percentage points. We also saw an increase of +0.2 percentage points in our U.S. Hispanic and Latinx populations. Globally, we increased the number of women represented from the previous year by +1.4 percentage points.
We also maintained our focus on empowering a pipeline of employees to grow professionally and personally. We built out the GitHub Early in Profession program for individuals who have less than three years of professional experience. Our GitHub Intern Program, designed to recruit university talent for potential full-time roles after graduation, grew by 184% from last fiscal year. Additionally, 38% of our U.S. intern cohort were women, and 41% were Hispanic/Latino or African American/Black.
These programs foster an inclusive workforce, supporting talent as the company scales.
Community, code, and culture
Here at GitHub, we know it’s not just about us—we have a responsibility to help the greater community access the goodness of open source and tech. To that end, we delivered impactful programs, collaborated with key partners, and supported thousands of individuals worldwide.
In 2024, we skilled more than 1,700 learners through the Social Impact team’s depth-driven programming of open source curriculum, hackathons, virtual leadership and mentorship opportunities, and more. In addition, together with Major League Hacking, we distributed $20,000 in grants to fund over 30 events, supporting 2,500 learners to develop hands-on experience as a part of career pathing in open source. We also launched All In Africa. This initiative is dedicated to making open source education accessible to everyone across the continent. It also supports a future where open source projects and global tech companies can tap into an expanding skilled workforce and meet the demands of a rapidly evolving tech landscape while furthering the prosperity of African economies.
At GitHub, we have nine Communities of Belonging (CoB) that help nurture our culture. These communities support a positive employee experience by generating energy within their respective groups and across the company. They create safe spaces for employees to connect and be supported personally and professionally, while also providing opportunities for members to lead diversity initiatives that align with the business’ innovation and corporate social responsibility goals. In all, our CoBs cultivate a culture of inclusion, connection, and shared growth—ensuring everyone at GitHub can thrive.
Voices, vision, and values
AI is changing the world of software, and we’re committed to ensuring that developers can benefit from it without contributing to societal harms. As such, 2024 has been a defining year for supporting responsible AI programs. We joined the AI Elections Accord, a cross-industry initiative to combat the deceptive use of AI in elections (see our progress update for more). GitHub co-hosted a workshop on responsible practices for open source AI with the Partnership on AI, which led to a report on risk mitigation strategies for the open foundation model value chain.
We have also continued our broad support of research and data that advances the understanding of developers’ contributions to innovation, development, and societal resilience throughout the world. Following the launch of the GitHub Innovation Graph, we now have four full years of data available for anyone to analyze and explore, and have made clarifying updates in response to feedback. In our most recent data release, we featured a conversation with economic researchers who are using GitHub Innovation Graph data to estimate the impact of generative AI tools on software development activity.
Innovation, inclusion, and impact
As the world’s home for open source and the greater developer community, we ensure that everyone can use their ingenuity and creativity to build great things—including those with disabilities. In 2024, we continued to invest in accessibility as one of our engineering fundamentals, which serves as the foundation for accessibility governance at GitHub. Our new Accessibility Design Bootcamp, completed by over 50% of our design team so far, provided exercises and discussions to raise awareness of web accessibility best practices and to empower designers to create more accessible products. In addition, we launched company-wide accessibility training and continued to improve on our accessible interview process globally. Finally, we continued to amplify the voices of disabled developers by publishing another four installments of the Coding Accessibility series and the accessibility playlist on our YouTube channel.
Continuing our journey together
Looking ahead, our priority is to further enrich the employee experience at GitHub, as well as help create a more inclusive and diverse industry. We’ll continue to provide learning, education, networking, and social impact opportunities to our employees. Also on our roadmap, we’ll partner with open source programs worldwide, nurture our CoBs, lead the change in leveraging AI ethically, support research that advances our understanding of the greater developer community, and create more accessible software. We’re excited to reach even more developers and the innovation opportunities that will inevitably arise. Together, let’s build what’s next.
To learn more about how GitHub is advancing our DI&B strategy read the full report >
]]>Madison Oliver<![CDATA[Securing the open source supply chain: The essential role of CVEs]]>https://github.blog/?p=805312024-10-21T14:02:26Z2024-10-21T16:00:45ZVulnerability data has grown in volume and complexity over the past decade, but open source and programs like the Github Security Lab have helped supply chain security keep pace.
]]>As security continues to shift left, developers are increasing as the first line of defense against vulnerabilities. In fact, open source developers now spend nearly 3x more time on security compared with a few years ago—which is an incredible development, considering how much the world relies on open source software.
I’m Madison Oliver and I manage the team that curates the vulnerability data here within the GitHub Security Lab, where developers and security professionals come together to secure the open source software (OSS) we all rely on.
At GitHub, we’re dedicated to supporting open source—including securing it.
Our researchers are constantly keeping the OSS ecosystem aware of vulnerabilities by discovering and disclosing new vulnerabilities, educating the community with research, performing variant analysis for OSS projects, and curating the GitHub Advisory Database, our own vulnerability reporting database dedicated to open source. We also regularly assign and publish vulnerabilities to the broader vulnerability management ecosystem on behalf of OSS maintainers. Much of this is done through Common Vulnerabilities and Exposures (CVEs).
Whether you’re contributing to open source software, maintaining a project, or just relying on open source like most developers, CVEs help keep that software secure. CVEs and the broader vulnerability landscape have grown and changed drastically in recent years, but we’ve kept pace by empowering the open source community to improve their software security through policies, products, open source solutions, and security automation tools.
Let’s jump in.
What is a CVE?
A CVE is a unique identifier for a vulnerability published in the CVE List, a catalog of vulnerability records. MITRE, a non-profit spun out of the MIT Lincoln Laboratory, maintains the catalog and the CVE Program with the goal of identifying, defining, and cataloging publicly-disclosed cybersecurity vulnerabilities. We actively contribute back to the CVE Program through serving on working groups and the CVE Program board, providing feedback and helping ensure that this critical security program is aligned with open source developers’ needs.
At GitHub, we have a unique perspective on CVEs: we not only use CVE data for our internal vulnerability management and for our Advisory Database, which feeds into Dependabot, code scanning, npm audit, and more, but also create it. Since 2019, we have managed two CVE Numbering Authorities (CNAs)—special entities allowed to assign and publish CVE IDs—where we produce CVE data, much of it provided by OSS maintainers. In 2019, we published 29 CVEs (CVE-2019-16760 was the first) and last year, we published more than 1,700.
We’re not the only ones seeing an increase in vulnerability data. In fact, it’s one of the bigger industry-wide changes of the past decade, and it has implications for how we keep software secure.
The double-edged sword of increased vulnerability data
When the CVE Program originated in 1999, it published 321 CVE records. Last year, it published more than 28,900, increasing 460% in the past decade—and the amount is expected to continue growing.
This growth means downstream consumers of vulnerability data—like yourself and our Advisory Database curation team—have more and more vulnerability data to sift through each day, which can lead to information overload. It also means increased vulnerability transparency (that is, making vulnerability information publicly available), which is fundamental to improving security across the industry. After all, you can’t address a vulnerability if you don’t even know about it. So, while this increase in data may seem overwhelming, it also means we are becoming much more aware.
But we’re not just dealing with more data; we’re facing a larger variety of vulnerabilities that have a greater impact through network effect. Thankfully, better data sources and increased automation can help manage the deluge. But first, let’s better understand the problem.
New vulnerability types and their widening impact through the software supply chain
We’ve also seen an increase in cloud-related vulnerability disclosures—not because the cloud is a new concept, but because disclosing vulnerabilities in cloud-related products has long been a point of contention. The prevailing reasoning against disclosing cloud vulnerabilities was to avoid generating alerts that don’t require user action to remediate. But as cloud-based technologies have become integral to modern development, the need for transparency has outweighed the perceived negatives. The CVE rules were updated this year to encourage disclosures, and major vendors like Microsoft have publicly stated that they’re making this change to support transparency, learning, safety, and resilience of critical cloud software.
Beyond cloud vulnerabilities, the 2021 edition of the OWASP Top 10 also saw an increase in vulnerabilities due to broken access controls, insecure design, security misconfigurations, vulnerable or outdated components (like dependencies), and security logging and monitoring failures.
Whatever the vulnerability type, new categories of vulnerabilities often require new remediation and prevention tactics that developers must stay on top to keep their project secure. When a spur of research leads to a dramatic increase in vulnerability disclosures, development teams may need to spend significant effort to validate, deduplicate, and remediate these unfamiliar vulnerabilities. This creates a huge, time-sensitive burden for those responding, during an urgent time when delays should be avoided.
To complicate matters even further, these new vulnerability types don’t even need to be in your code to affect you—they can be several layers down. The open source libraries, frameworks, and other tools that your project depends on to function—its dependencies—form the foundation of its supply chain. Just like vulnerabilities in your own code, vulnerabilities in your supply chain can pose a security risk, compromising the security of your project and its users.
For example, our 2020 Octoverse report found that the median JavaScript project on GitHub used just 10 open source dependencies directly. That same repository, however, can have 683 transitive dependencies. In other words, even if you only directly include 10 dependencies, those dependencies come with their own transitive dependencies that you inherit. Lacking awareness of transitive dependencies can leave you and your users unknowingly at risk, and the sheer number of transitive dependencies for the average project requires automation to scale.
More security data coming straight from open source
Since starting as a CNA in 2019, the open source GitHub CNA has grown so much that we are now the 5th largest CVE publisher of all time. This shows that open source maintainers—who are the source of this data—want to play a role in the security landscape. This is a big shift, and it’s a boon for open source, and everyone who relies on it.
Indulge me for a brief history lesson to illustrate the degree of this change.
For a significant portion of the CVE Program’s history, MITRE was the primary entity authorized to create, assign, and publish CVE IDs. While CNAs have existed since the program’s inception, their only duty until 2016 was to assign IDs. As the demands on the program grew, they led to scalability issues and data quality concerns, so the program expanded CNA duties to include curating and publishing CVE record details. Since then, the program has made significant efforts to increase the number of CNAs engaged in the program, and now has over 400 partners from 40 countries.
Nowadays, more than 80% of CVE data originates directly from CNAs like ours. The explosion in CNAs has helped scale the program to better support the growing number of requests for CVEs, and almost more importantly, also means more primary sources of vulnerability data. Since CNAs must have a specificscope of coverage, as opposed to CNAs of Last Resort (CNA-LR) like MITRE, whose scope is everything else that isn’t already covered, a CNA’s scope tends to include software that it owns or is heavily invested in securing.
The overwhelming benefit of this structure is that subject matter experts can control the messaging and vulnerability information shared with unique communities, leading to higher quality data and lower false positives. For us, this means a larger focus on securing open source software—and for any developer who contributes to or uses open source, that means more secure outcomes. Maintainers can ensure that they’re the primary source of vulnerability information on GitHub by leveraging repository security advisories to notify their end users and enabling private vulnerability reporting to help ensure that new vulnerabilities reach them first.
Looking to level up your skills in software security?
Check out the GitHub Secure Code Game developed by our Security Lab. It provides an in-repository learning experience where users can secure intentionally vulnerable code!
Tackling data overload with automation
Let’s return to that double-edged sword we started with: there’s more vulnerability data than ever before, which means more visibility and transparency, but also more data to sort through. The answer isn’t to reduce the amount of data. It’s to use automation to support easier curation, consumption, and prioritization of vulnerability data.
Keeping track of the number of direct dependencies at scale can be burdensome, but the sheer number of transitive dependencies can be overwhelming. To keep up, software bill of materials (SBOM) formats like SPDX and CycloneDX allow users to create a machine-readable inventory of a project’s dependencies and information like versions, package identifiers, licenses, and copyright. SBOMs help reduce supply chain risks by:
Providing transparency about the dependencies used by your repository.
Allowing vulnerabilities to be identified early in the process.
Providing insights into the security, license compliance, or quality issues that may exist in your code base.
Enabling you to better comply with various data protection standards through automation.
When it comes to reporting vulnerabilities, CVE Services has been extremely helpful in reducing the friction for CNAs to reserve CVE IDs and publish CVE Records by providing a self-service web interface—and that CVE data is a critical data source for us. It accounts for over 92% of the data feeding into our Advisory Database, so anything that helps ensure this information is published faster and more efficiently benefits those using the data downstream, like our team, and by proxy, developers on GitHub!
At GitHub, we leverage APIs from our vulnerability data providers to ingest data for review, export our data in the machine-readable Open Source Vulnerability (OSV) format for consumption by others, and notify our users automatically through Dependabot alerts. While the increased automation around vulnerability data has allowed for easier reporting and consumption of this data, it’s also led to an increased need to automate the downstream impact for developers—finding and fixing vulnerabilities in both your own code and within your dependencies.
Automated software composition analysis (SCA) tools like Dependabot help identify and mitigate security vulnerabilities in your dependencies by automatically updating your packages to the latest version or filing pull requests for security updates. Keep in mind that the coverage of SCA tools can often vary in scope—the GitHub Advisory Database and osv-scanner emphasize vulnerabilities in open source software, while grype focuses on container scanning and file systems—and ensure that their SCA solution supports the types of software in their production environment. Prioritization features in SCA tools, like Dependabot’s preset and custom auto-triage rules, can help users more efficiently manage data overload by helping determine which alerts should be addressed.
Static application security testing (SAST) and SCA tools will both help you detect vulnerabilities. While SCA is geared towards addressing open source dependencies, SAST focuses more on vulnerabilities in your proprietary code. GitHub’s SAST tools like code scanning and CodeQL help find vulnerabilities in your code while Copilot Autofix simplifies vulnerability remediation by providing natural language explanations for vulnerabilities and suggesting code changes.
As the vulnerability landscape continues to evolve and aspects of vulnerability management shift left, it’s critical that open source developers are empowered to engage in security. The double-edged sword of increased vulnerability data means more awareness, but requires automation to manage properly, especially when considering the wider impact that supply chain vulnerabilities can cause. At GitHub and within the Security Lab, we are committed to continuing to support and secure open source by providing tools, guidance, and educational resources for the community as software and vulnerabilities progress.
]]>Sidney Espinosa<![CDATA[GitHub for Nonprofits: Drive social impact one commit at a time]]>https://github.blog/?p=804332024-10-17T16:08:51Z2024-10-17T17:00:06ZNow, it’s easier than ever for nonprofits to receive GitHub product discounts.
]]>Over the past few years, we’ve seen the number of nonprofits leveraging GitHub grow—and grow. Technology is increasingly becoming a critical part of nonprofit’s strategies to drive forward their missions, accelerate human progress, and take big strides toward the Sustainable Development Goals. And we’re here to make this process easier and more accessible for all—from local grassroots organizations to global nonprofits.
Welcome to GitHub for Nonprofits. This new portal makes the sign up process seamless, with exclusive discounts automatically applied to your account.** Verified nonprofits are eligible for free access to the GitHub Team plan or 25% off the GitHub Enterprise Cloud plan.** This includes nonprofit organizations that are 501(c)(3) or equivalent and are non-governmental, non-academic, non-commercial, non-political in nature, and have no religious affiliation.
Wondering how GitHub could practically help your nonprofit? Here are a few ways they’ll help you drive your mission forward:
Manage your projects. Investing in GitHub is not just about adopting a tool; it’s about leveraging technology to reach goals in a collaborative way.
Increase visibility and widen impact. By hosting projects on GitHub, nonprofits can increase their visibility and reach a wider audience. Whether it’s sharing code libraries, publishing research, or showcasing success stories, GitHub provides nonprofits with a platform to amplify their impact and attract support from donors, funders, volunteers, and partners.
Connect with the open source community. GitHub is home to the largest open source communities on the planet. By hosting your projects on GitHub, you can tap into this incredible pool of talent and expertise. Need help with a tricky problem? Want to attract volunteers to your cause? GitHub has you covered.
This seamless way of signing up may be new, but the adoption of GitHub by nonprofit organizations is tried and true. We have customers around the world using GitHub for good, and they have the results to show it:
“GitHub provides us with a platform to amplify the critical needs of forcibly displaced persons and attract support from donors, volunteers, and partners, while also tapping into skills and resources of an incredible developer community.” – Seema Iyer, USA for UNHCR
“As a nonprofit, when we want to develop something new, we have to figure out a way to do that with limited resources and a small team. GitHub is a big part of our productivity every single day and we’ve recently leveraged different features to develop an algorithm to bring a new level of impact reporting to our donors. This has helped us unlock new efforts that we wouldn’t have been able to do otherwise and has enabled our team to start imagining new opportunities for the future.” – Christa Stelzmuller, charity: water
“With GitHub, we unite developers worldwide, turning open source technology into a force for good—fighting poverty, one line of code at a time.” – Sandino Scheidegger, Switzerland for Social Income
Join GitHub for Nonprofits, where technology meets purpose, and together, let’s create a more sustainable and equitable future for all.
 )
)


 New this year: wildcards (for extra nerd cred)