Explore the seasons of software development with four full years of data
Discover the latest trends and insights on public software development activity on GitHub with the release of Q4 2023 data for the Innovation Graph.

With today’s Q4 2023 data release, the GitHub Innovation Graph now offers four full years of data on eight metrics–Git pushes, repositories, developers, organizations, programming languages, licenses, topics, and economy collaborators. We’ve also made some clarifying updates in response to community feedback we’ve heard since we launched. But first, let’s briefly bask in the glory of having four full years of quarterly data to explore by taking a quick look at some of the seasonal patterns that show up in the data.
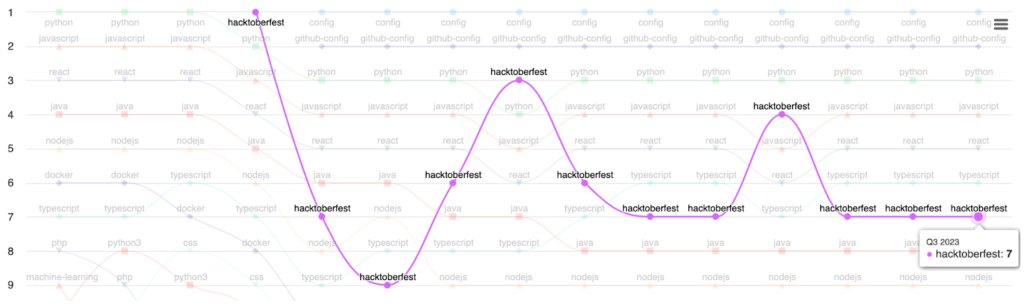
Long-time visitors of the GitHub Innovation Graph will, of course, remember that the “hacktoberfest” topic prominently exhibits seasonal variation:
Rank of topics globally
With the benefit of another full year of data, we’d like to highlight another popular cyclical developer pastime that might have flown under the radar for those who haven’t explored the underlying dataset files, as its lower ranking prevents it from appearing in our site’s summary charts: Advent of Code.
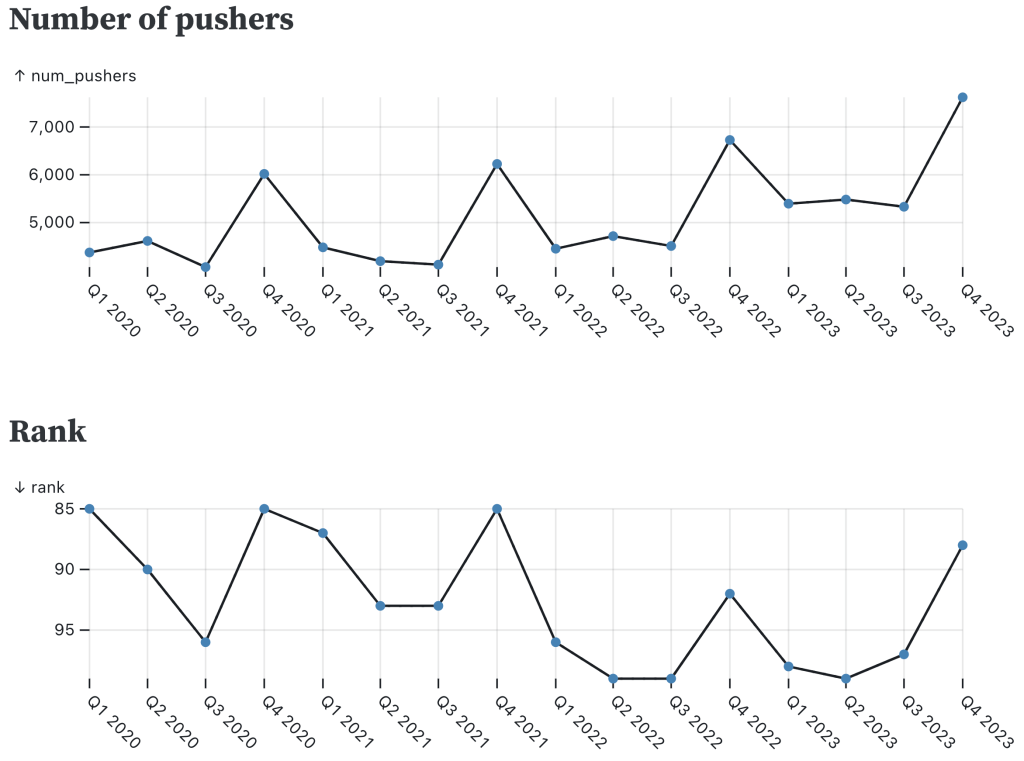
Pushers and rank for the “advent-of-code” topic
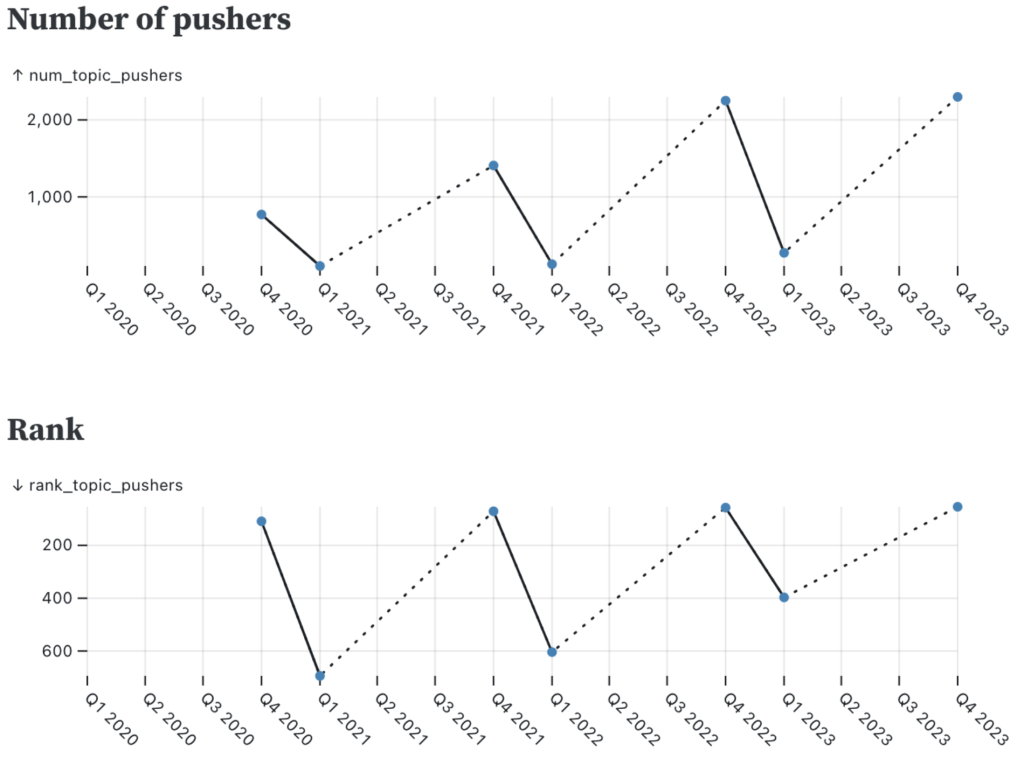
Dotted lines indicate where there are gaps between quarterly data points due to the activity not meeting our minimum threshold for reporting.
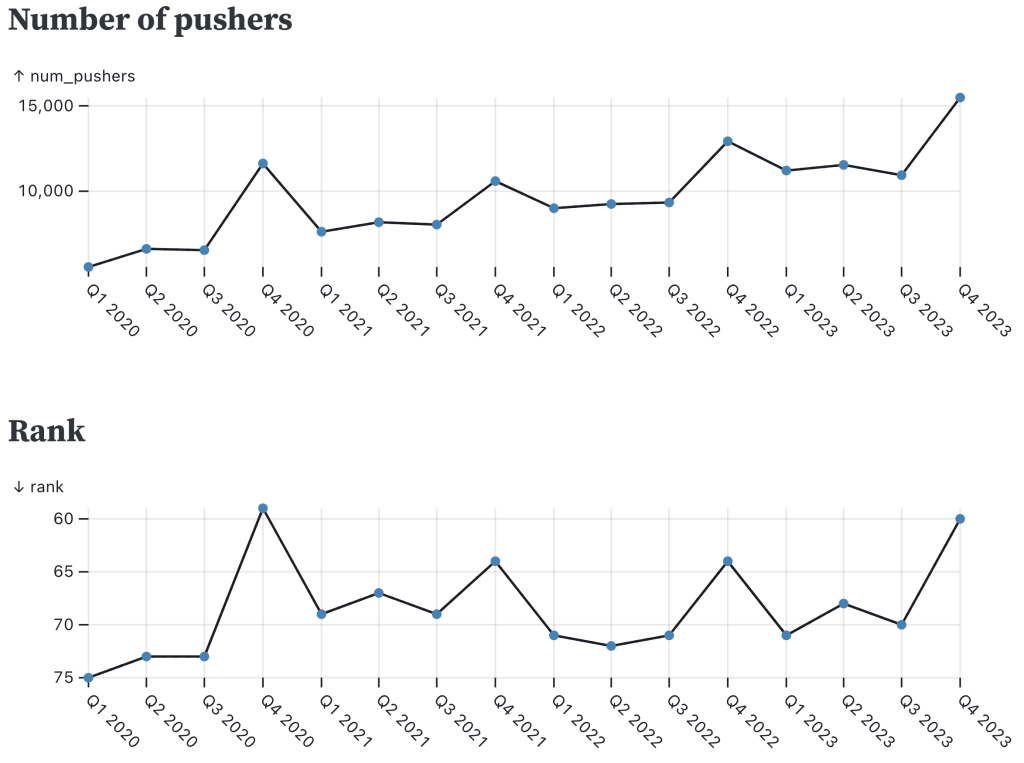
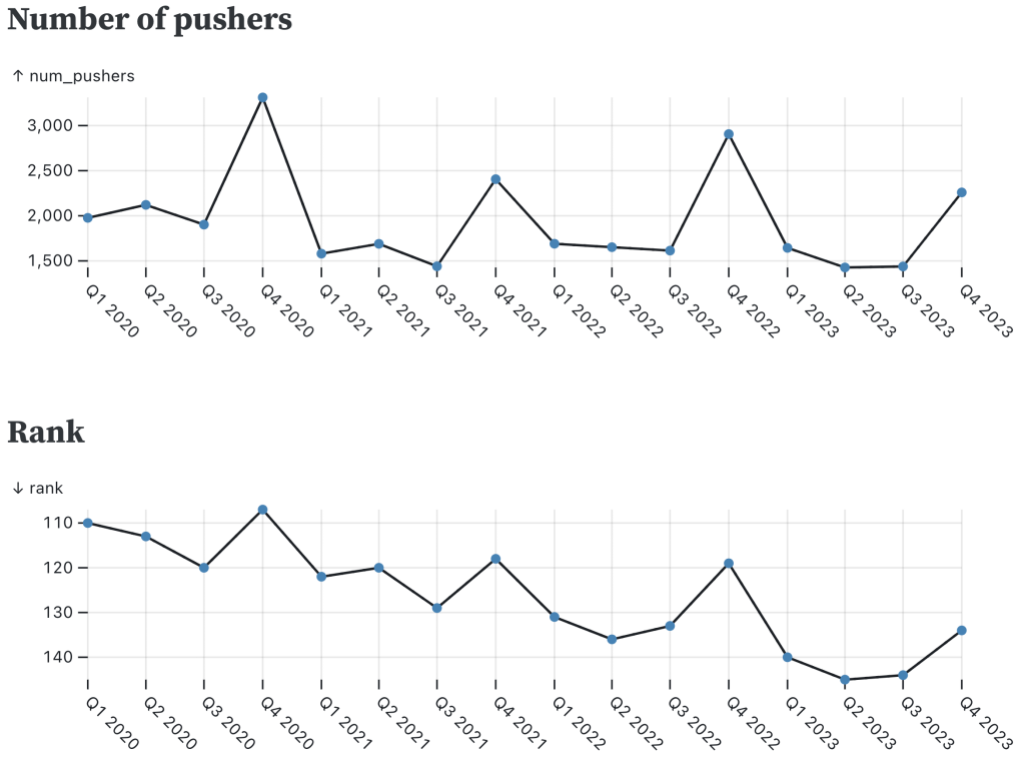
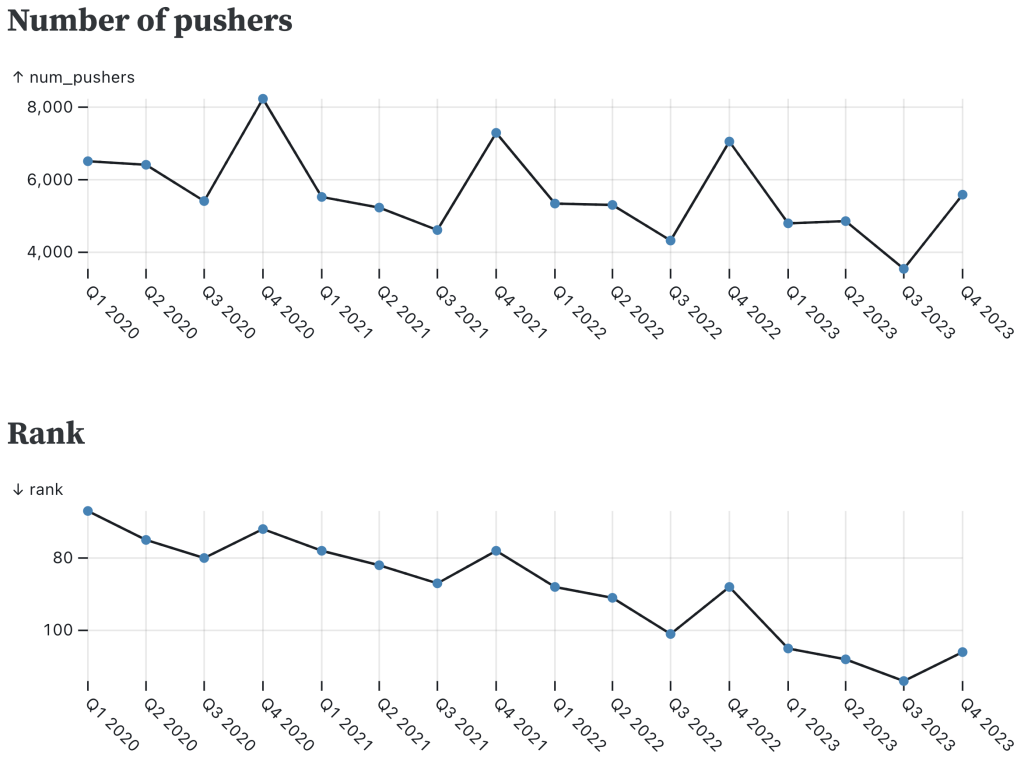
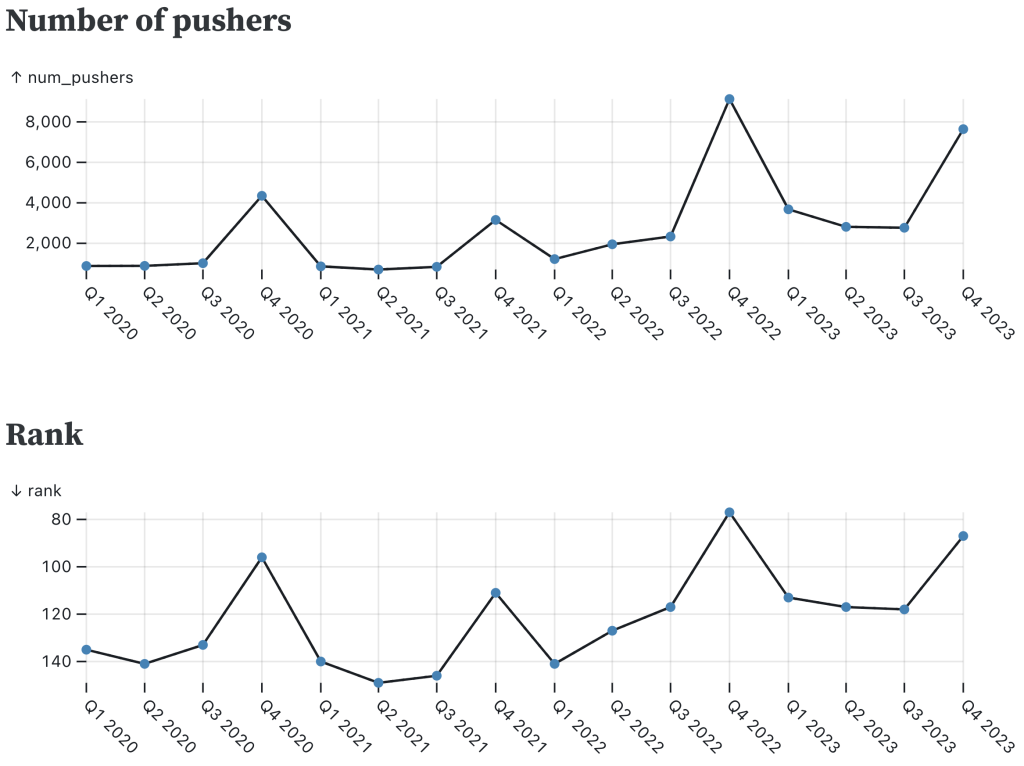
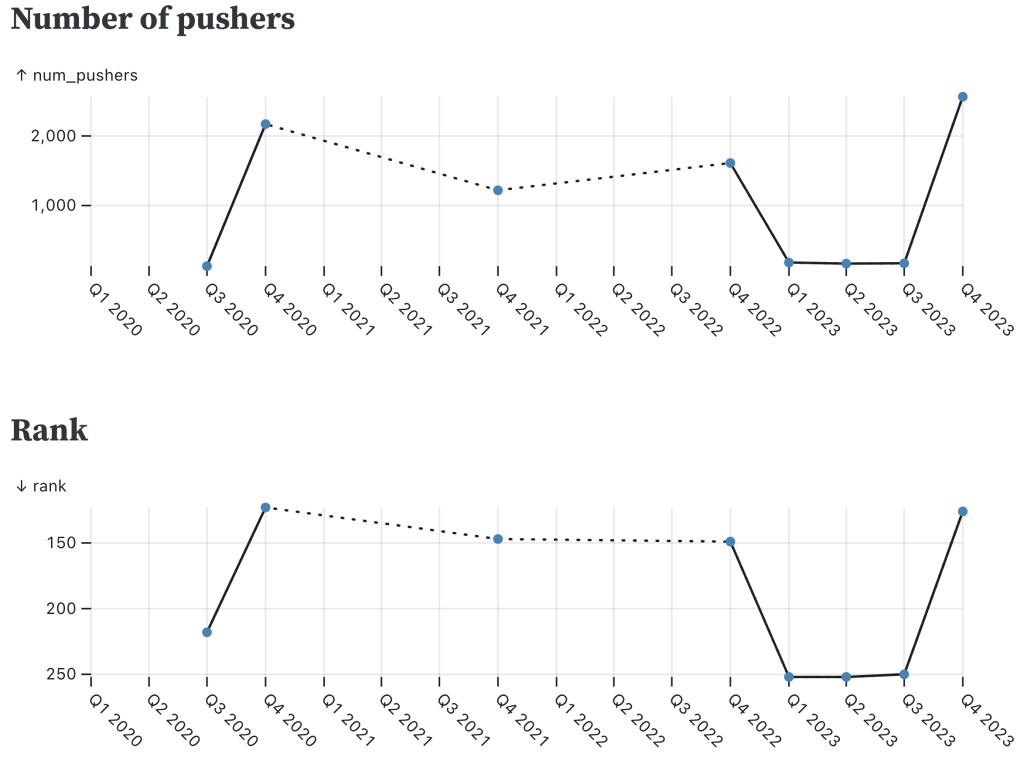
Advent of Code is an annual event founded and run by Eric Wastl, where participants solve daily coding challenges from December 1 to December 25. Often, developers participate in Advent of Code as a reason to try learning a language they’re less familiar with, sometimes with the encouragement of developer advocate programs. We can see this trend emerge in the following plots based on the Innovation Graph’s programming languages dataset:
Pushers and rank for the COBOL programming language

In case you missed it, these are the developers who, with the help of AI, will save us from the next financial crisis.
Pushers and rank for the Julia programming language
Pushers and rank for the ABAP programming language

Pushers and rank for the Elm programming language
Pushers and rank for the Erlang programming language
Pushers and rank for the Processing programming language
Pushers and rank for the Brainf*ck programming language
Pushers and rank for LOLCODE programming language
Dotted lines indicate where there are gaps between quarterly data points due to the activity not meeting our minimum threshold for reporting.
Sometimes, it’s also interesting to see when cycles are broken, which we’re seeing with the steady rise of documentation:
Global ranking of the “documentation” topic
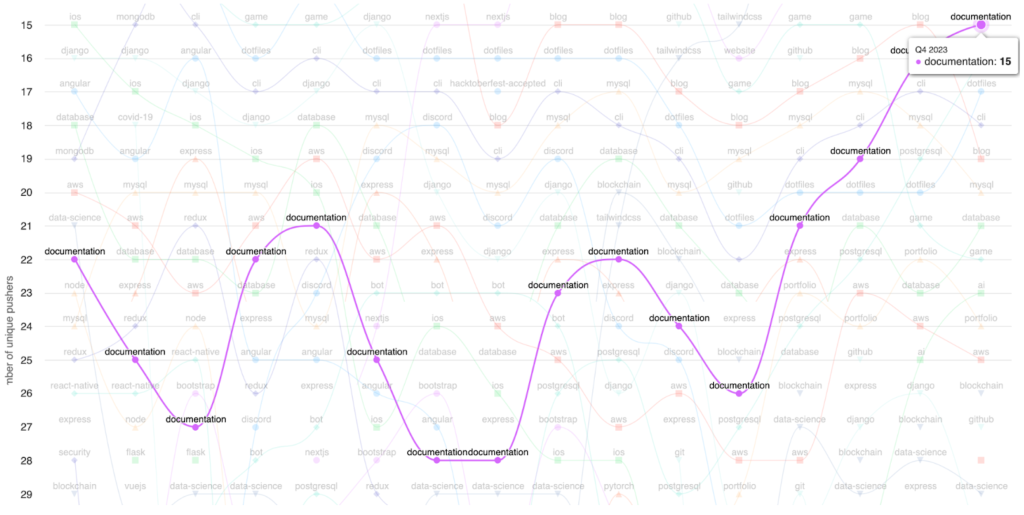
The seasonal variation in the “documentation” topic from Q1 2020 through Q4 2022 might be related to Google Season of Docs, a program to help open source projects with documentation, which has been operating since at least 2019. However, we didn’t see the usual cyclical dip of the “documentation” topic during 2023, which might be explained by the release of chat-based generative AI interfaces like ChatGPT in November 2022 and several similar products shortly afterwards, including GitHub Copilot Chat in March 2023. While we recognize that it’s not a panacea, perhaps generative AI technologies are helping to reduce the friction around writing documentation to enable maintainers and contributors to update project documentation more widely and frequently.
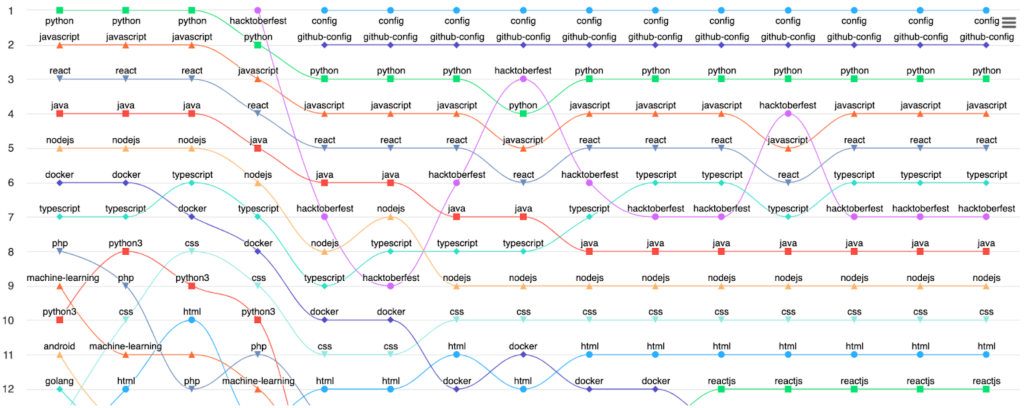
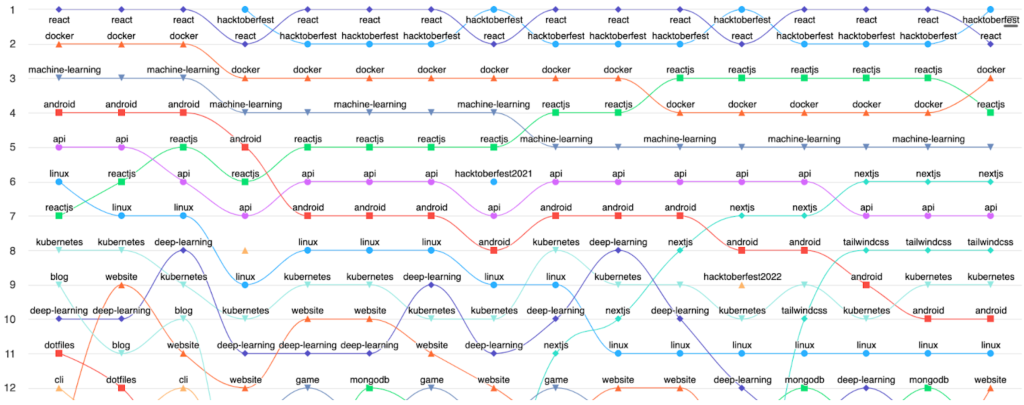
Programming languages and GitHub profile README configuration topics are now excluded from the Topics bump charts
In terms of changes to the graph’s functionality, the Topics bump charts on the global metric page and individual economy pages no longer display programming languages or topics related to GitHub profile README configuration (“config” and “github-config”). As you can tell from the preceding sentence and heading, we have no qualms against repeating largely the same information multiple times. However, our repetition in including programming language-related topics in the Topics bump charts (despite the Innovation Graph also having dedicated Programming Languages bump charts) had the unfortunate effect of taking up so much space in the chart that it prevented users from noticing interesting movements of other topics (including those of advent-of-code!). Additionally, we figured that few readers outside of the GitHub teams responsible for the feature would be interested in the adoption of GitHub profile README configuration files, so we’ve excluded those from rendering, too.
Before:
After:
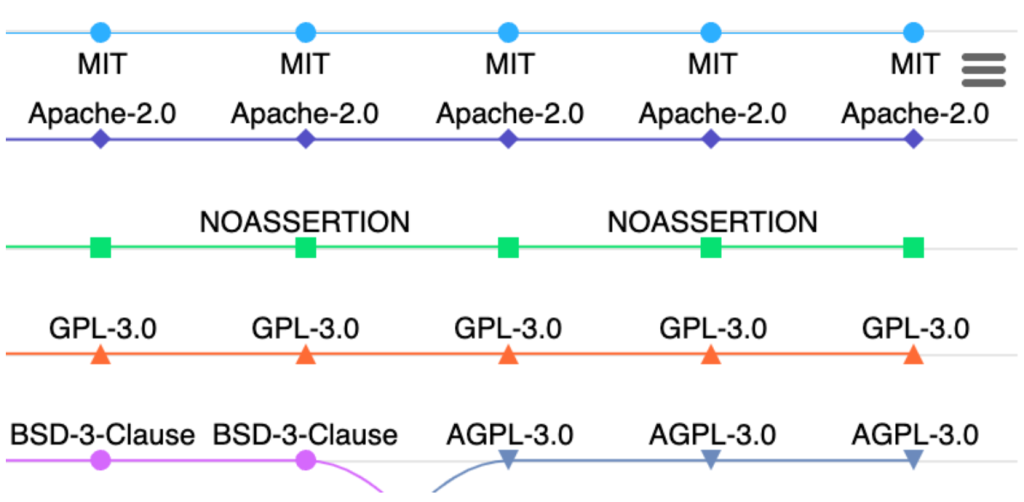
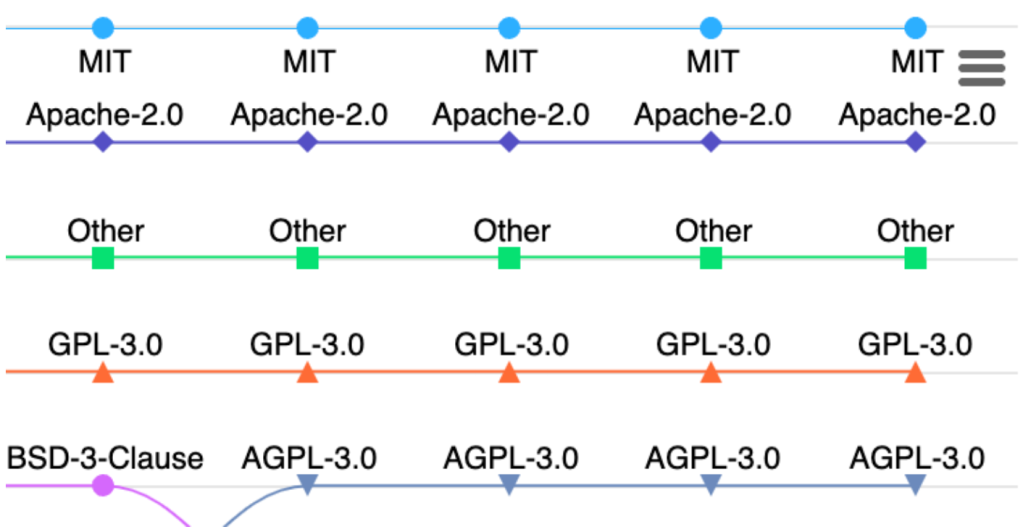
NOASSERTION changed to “Other” in the Licenses bump charts
As noted in feedback we received shortly after the launch of the Innovation Graph, the NOASSERTION classification is likely confusing to most Innovation Graph visitors, so we’ve updated the rendering on the bump charts to display “Other” instead.
Before:
After:
Clarification: the repositories, developers, and organizations metrics include “inactive” entities
We’ve also added an explanatory note for the repositories, developers, and organizations metrics to highlight that these counts include inactive entities (for example, not just users who were active during a given quarter).
So, there you have it. We’ve now got four full years of data to explore. Countless more stories no doubt abound within the data, so don’t wait–spin up a Jupyter Notebook via GitHub Codespaces, ask Microsoft 365 Copilot in Excel, or use any of the vast array of open source data analysis tools out there to explore the files, and we can’t wait to see what you discover.
Tags:
Written by

Related posts

GitHub availability report: June 2026
In June, we experienced six incidents that resulted in degraded performance across GitHub services.

Q1 2026 Innovation Graph update: Open source collaboration is accelerating worldwide
New Innovation Graph data shows global developer communities growing faster than ever, with collaboration reaching new highs across many economies.
GitHub joins coalition advocating for fixes to California AI Transparency Act to protect open source
We’re calling for targeted amendments to resolve conflicts with open source licensing and align with international transparency frameworks while preserving regulatory intent.