New data and visualizations highlight the resilience of international developer collaboration
Discover the latest trends and insights on public software development activity on GitHub with the release of Q3 2023 data for the Innovation Graph.

The GitHub Innovation Graph is a jumping off point for research, analysis, and insights into how the world is building software together. Along with releasing quarterly data on eight metrics–Git pushes, repositories, developers, organizations, programming languages, licenses, topics, and economy collaborators–we’re also exploring new features to better visualize public software development activity on GitHub. With today’s Q3 2023 release, we invite you to explore the data and our new data visualization feature, stacked area charts for economy collaborators.
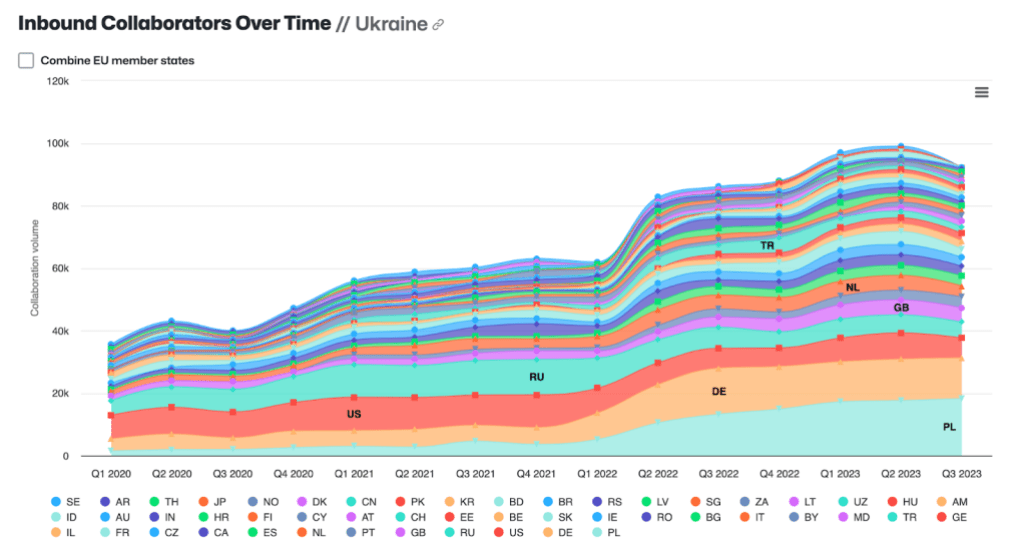
Stacked area charts make it easier to see how the economy collaborators metric (Git pushes sent and pull requests opened by a developer in one economy to a repository owned by another developer or organization in a different economy) changes over time. This is especially useful when considering how world events may influence software development collaboration. For example, looking at inbound collaboration, or economies whose developers sent Git pushes or pull requests to repositories maintained by developers in Ukraine, there was a notable increase in Q1 2022, coinciding with international support for Ukraine following the Russian invasion. After making that initial jump in Q1 2022, inbound collaboration continued to rise, suggesting sustained support. This clearly demands more in-depth analysis, and we encourage anyone who’s curious to delve into the GitHub Innovation Graph website, where you can play around with the charts and download the data for your own research.
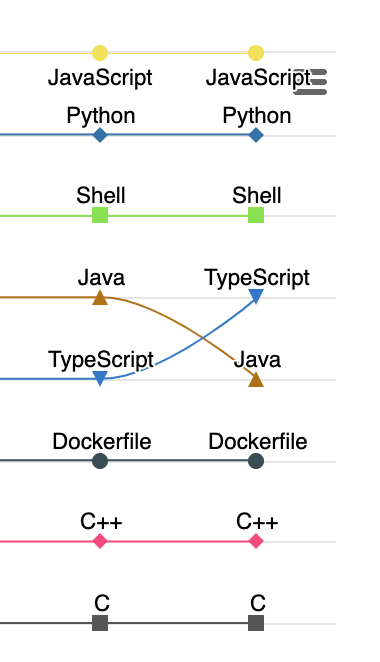
Q3 2023 showed how dynamic the software ecosystem can be. As noted in the 2023 Octoverse report, “TypeScript overtook Java for the first time as the third most popular language across OSS projects on GitHub,” which happened in Q3.
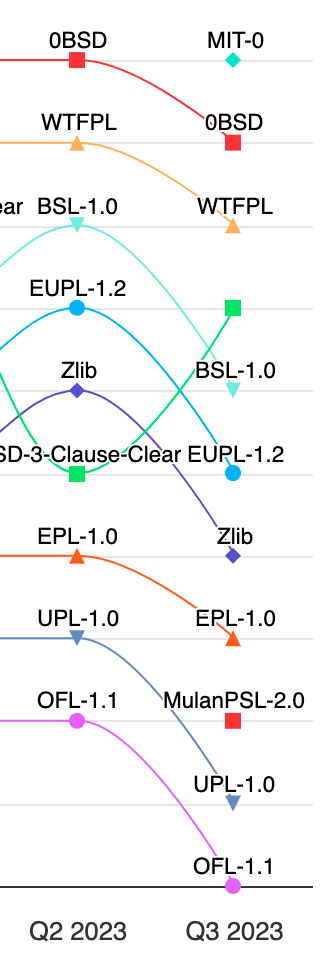
We also witnessed the MIT-0 and Mulan licenses make their first appearances in the top licenses chart in Q3 2023. The MIT-0 license builds off of the popularity of the MIT license without requiring preservation of copyright and license notices. Amazon Web Services (AWS) pioneered the use of MIT-0 for example code. The Mulan license, a permissive license similar to Apache-2.0, is the first open source license in both Chinese and English approved by the Open Source Initiative, and demonstrates the significance of the vibrant Chinese developer community.
We welcome your feedback and suggestions on improvements to the GitHub Innovation Graph, and would love to hear how you’ve used the data. Please feel free to open an issue with your ideas.
Tags:
Written by

Related posts

What’s coming to our GitHub Actions 2026 security roadmap
A look at GitHub Actions’ 2026 roadmap, outlining how secure defaults, policy controls, and CI/CD observability harden the software supply chain end to end.
Updates to GitHub Copilot interaction data usage policy
From April 24 onward, interaction data—specifically inputs, outputs, code snippets, and associated context—from Copilot Free, Pro, and Pro+ users will be used to train and improve our AI models unless they opt out.

GitHub availability report: February 2026
In February, we experienced six incidents that resulted in degraded performance across GitHub services.