How the Grafana Alerting team scales their issue management with GitHub Projects
Hear from Grafana Labs’ Armand Grillet about how his team uses GitHub Projects.
| At GitHub you’ve heard us talk about how we are using GitHub Projects and GitHub Actions to plan and track our work and now we’ve asked one of our customers, Grafana Labs, to share how their teams are approaching work in a new way. Whether they are managing open source requests, operational tasks, or escalations, the Grafana Labs Alerting team uses GitHub Projects to manage all these issues efficiently. |
 Let’s hear more from Armand Grillet, Senior Engineering Manager at Grafana Labs, including how his teams use tasklists to break work into manageable tasks, use a common set of labels to filter tasks, create multiple views on a single project to meet the needs of different teams and stakeholders, and use automation to enable engineers to stay focused on the code.
Grafana is a leading open source platform for monitoring and observability, which is why the Grafana Labs GitHub organization is the center of our engineering efforts with nearly 1,000 repositories, including eight having more than 2,000 stars. In addition to this open source work, Grafana Labs engineers also work on the Grafana Cloud observability platform and its customers’ escalations.
As the manager of the Grafana Alerting and service-level objectives (SLOs) backend teams at Grafana Labs it was essential to have one project board that benefited our multiple stakeholders: team members, other employees, as well as the open source community. Our GitHub Project has offered us the opportunity to do just that. You can even make a copy of our board and adapt it for your own project needs, using the ‘make a copy’ functionality.
One view for each team, assembled around task lists
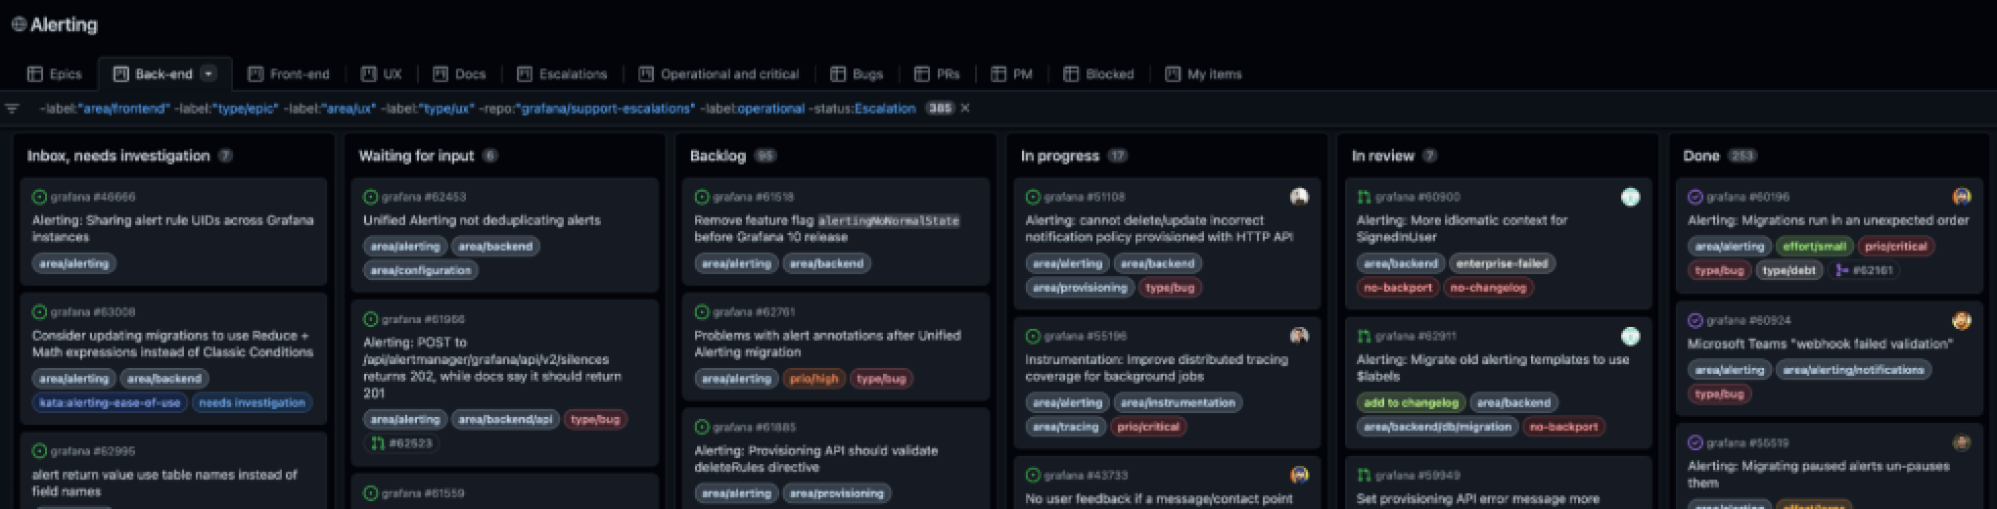
Grafana Alerting has contributors working across four teams: backend, front-end, UX, and docs. Each of these contributor types has their own view in our project. The field options (thus the columns) are the same for each of these views:
- Inbox—not reviewed yet
- Waiting for input—open source issues that need more details
- Backlog—reviewed, priority depending on the milestone set
- In progress
- In review
- Done
These columns (custom fields) are intentionally generic. They can work for all teams, no matter whether the issue has been written by someone in the community or by someone internally. We use project filters based on labels, such as “area/frontend” to allow issues to be automatically added to the correct views once they are added to our project.
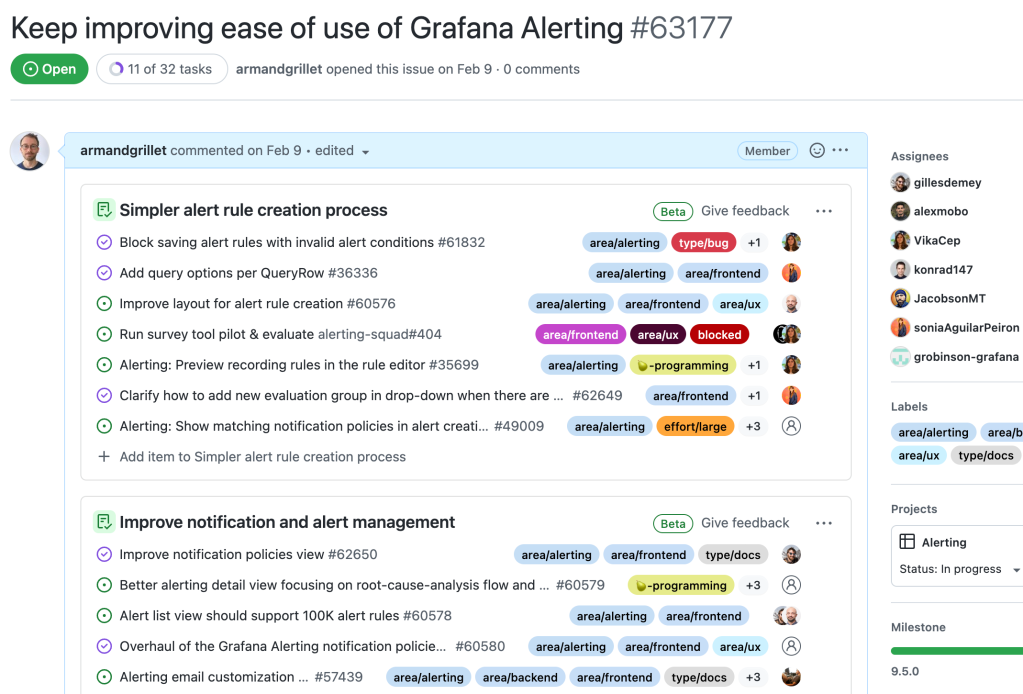
| Note: Tasklists are currently in private beta; you can sign your organization up for access on the GitHub Feature Preview portal |
For bigger issues, we make use of the GitHub tasklist feature to break down the work into tasks. We use labels to filter the tasks to be included in the relevant team’s view. This creates views that provide two different, but useful, kinds of information. For example, for the docs team:
- Smaller issues with only the label “type/docs” are items the docs team needs to work on.
- Bigger issues containing task lists with the label “type/docs” along with labels for additional areas (for example, “area/frontend”) are issues with a dependency on the docs team, but the item is not owned by “docs.” For these bigger issues, if the status is “in progress” someone in the docs team should start checking how they can help.
As a manager of the backend team and project lead for Grafana Alerting, this workflow gives me peace of mind. Even if our docs team members miss some meetings, the Docs view in our project is always accurate, because engineers maintain the status of issues.
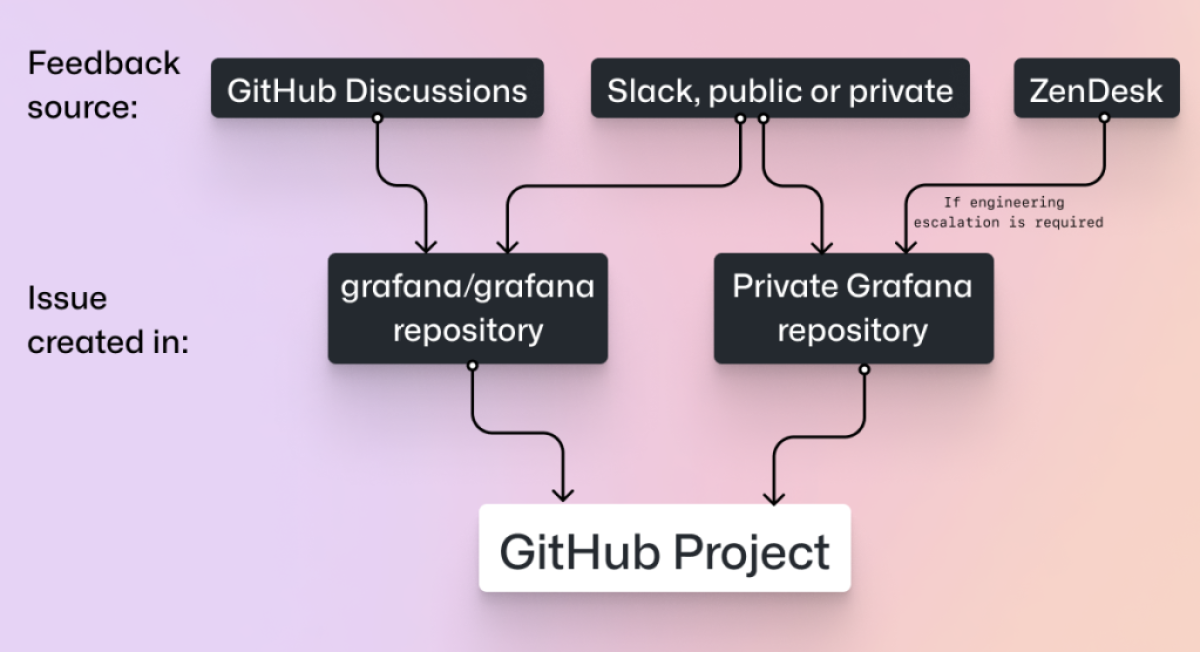
The four team views, combined with our “Epics” view (the first view in our board) that lists our big issues for an entire quarter, allow everyone to see our progress on Grafana Alerting. GitHub users who are part of the Grafana Labs organization can see all issues, whereas Github users within our community can only see issues in public repositories. As most of our issues live in the Grafana public repository this allows us to be transparent by default.
Whilst we use a private repository for issues relating to our operational work, we use the same labels in all our alerting-related repositories so that we can use project filters easily. Having common labels in many repositories creates an incentive to have the same labels in other repositories, especially new ones, even if they do not relate to alerting. This growing commonality makes searching for issues across multiple repositories easier, which is particularly useful for our product managers.
Custom fields to create tailored views
A valuable feature of GitHub Projects is the ability to have different columns (custom fields) per view. This allows us to view not only smaller issues but also larger issues covering an entire quarter. Our team also handles engineering escalations that are worked at a faster pace compared to normal issues.
As a team, our three custom fields are:
- Status: the default field for all issues except escalations (as mentioned above).
- Quarter: used for bigger issues that include tasklists.
- Escalation: used to capture more granular status of each escalation.
With these custom fields, we can have custom views, such as our epic view, which gives us a birds-eye view of our quarterly goals, and our escalations view, which lets us review the state of escalations that need engineering work.
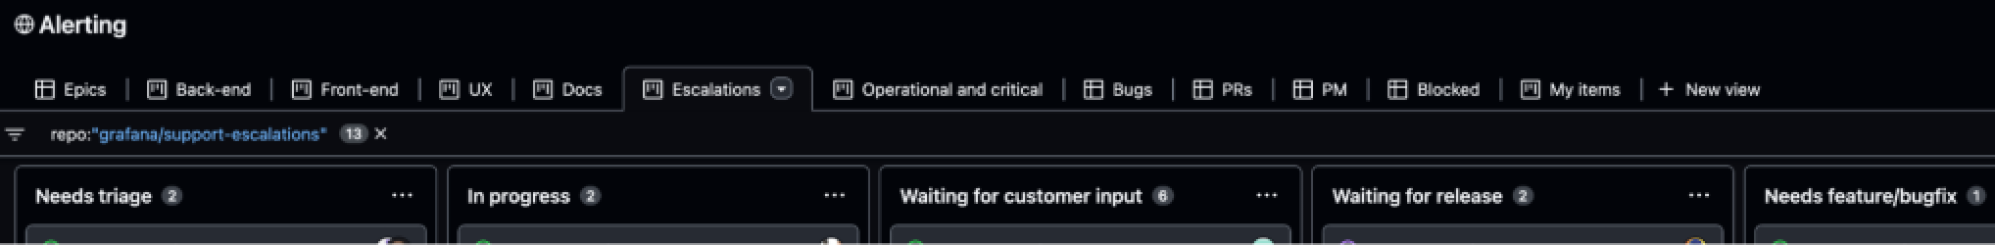
Thanks to the adaptability of GitHub Projects, we finally have one ‘source-of-truth’ to reference normal issues, big issues, and escalations.
Enhancing projects with GitHub Actions
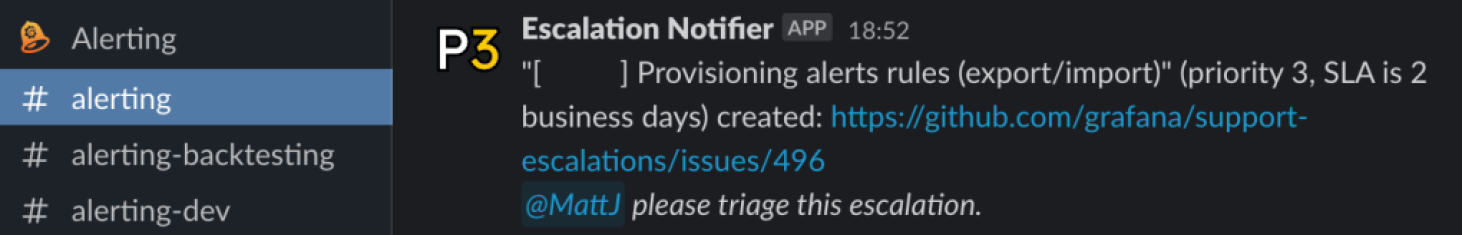
For escalations, which are urgent to solve, we also use GitHub Actions to notify us on Slack or use Grafana OnCall if this is a high priority escalation.
Combining GitHub Projects and GitHub Actions offers endless possibilities. Actions like github/issue-labeler allow us to have repositories shared by different teams with issues labeled automatically depending on keywords used in an issue. These labels are then used by other actions to add the issue to the right view or to send notifications to external systems. Opening the project and seeing that new relevant issues have been added automatically, ready for triage, feels like magic.
We often have escalations related to features requested by customers. Being able to link to an escalation in an open source issue allows engineers and product managers to prioritize together on one platform while keeping this information confidential from GitHub users outside our organization.
These automations have been important in terms of engineers’ motivation and our productivity. For example, the Grafana Alerting team receives around five issues from support regarding escalations per week. During the last quarter of 2022, at any given time, the team had on average only four open escalations due to the automation motivating engineers to prioritize this work. This is a significant reduction from the average of 20 open escalations at any given time prior to our shift to GitHub Projects and GitHub Actions.
GitHub Projects at scale
Since we started using GitHub Projects, our team has been growing. An important moment for me in our scaling was the creation of a new project for the team working on SLOs. Originally, this team had no escalations and a small number of engineers. We were able to easily make a copy of the ‘Alerting’ project, changing the filters to accommodate the new team’s repositories, too. The important question was whether the workflows we had for a big team would be too much for such a new team. The answer was yes, there were too many views, creating unnecessary overhead, but it was very easy to reduce the number of views to adapt to the new team’s needs. Using the existing project as a starting point for the SLO team enabled us to get a new project up and running fast.
After a year of using GitHub Projects, we have seen its ability to handle our different types of issues and to adapt to the needs of our various teams at Grafana Labs. We find GitHub Projects to be a flexible planning and tracking solution that enables engineers to stay focussed on code and gives issues more visibility. GitHub Projects keeps the burden for contributors low whilst still providing the views managers need to understand and plan team efforts. GitHub Projects is the only tool the Grafana Alerting team needs to do project planning.
Tags:
Written by

Related posts
Tame Dependabot: Group your updates, slow the cadence, keep security fast
Dependabot keeps your dependencies current, but its defaults can flood your repository with pull requests. Here’s how grouping updates, slowing the cadence, and keeping security fixes fast cut the noise on a Microsoft open source project.

The cost of saying yes has changed
The cost of writing code dropped; the cost of owning it didn’t. A framework for deciding which changes are actually cheap in the AI era.
Better tools made Copilot code review worse. Here’s how we actually improved it.
How migrating Copilot code review to shared Unix-style code exploration tools reduced review cost by reshaping agent workflows around pull request evidence.