How we tripled max concurrent jobs to boost performance of GitHub Actions
The GitHub Actions team has done lots of work to improve the performance and resource consumption of Actions on GHES in the past year.
GitHub Actions became generally available on GitHub Enterprise Server (GHES) with the 3.0 release about two years ago. Since then, we’ve made many performance improvements to the product that reduced GitHub Actions CPU consumption on the server and allowed us to run more GitHub Actions jobs concurrently. By the numbers, on 96-core machines, the max concurrent jobs went from 2,200 on GHES 3.2 to 7,000 on GHES 3.6 (the current release) a 3x performance improvement.
Here are some of the more interesting improvements we made to reach that mark and the lessons we learned along the way.
Fix 1: Just making sure caches are working
One fine day, we realized our hottest code path that we use to access workflow secrets and callback URLs wasn’t using a cache, though we assumed it was. This was a surprise to our team since we have extensive monitors for every new cache we add to the product, but this specific cache is something we thought we enabled years ago. Issues like this are hard to catch. We only caught this by analyzing the profile traces collected during load testing and in production. After one simple change to enable the cache, CPU usage went down fast, which translated to faster workflow execution and an increase in throughput. As it turns out, sometimes you don’t have to dig too deep in order to discover a big performance win.
Fix 2: Improving the orchestration framework
How it used to work
“Orchestration” is what GitHub Actions uses to run workflows. On a high level, it’s a durable state machine that makes workflow runs resilient to machine shutdowns and intermittent failures. To achieve durability, every time the orchestrator wakes up, it replays execution from the beginning to rebuild local state until either the code is finished or it encounters new work.
We store orchestration state in a database table. The issue we had is that we were saving the state in a single column in the database as one big blob of events.
CREATE TABLE tbl_OrchestrationSession (
   SessionId           BIGINT              NOT NULL,
   CreatedOn           DATETIME            NOT NULL DEFAULT GETUTCDATE(),
   LastUpdatedOn       DATETIME            NOT NULL DEFAULT GETUTCDATE(),
   ...
   State               VARBINARY(MAX)      NULL, -- this is where we store execution state
)
When updating the state for a running orchestration, we would read the whole blob into memory, append the new events to the end, and write it back to the database. We had unnecessary overhead in that we would delete a growing blob and then have to commit a slightly bigger (but almost exactly the same) value over and over when saving state. We had to read and deserialize a big blob every time when replaying the state.
What we did instead
We adopted a new version of orchestration that supports both incremental reads and incremental writes to the database. The state history is now in its own table instead of an inline binary blob. Now when we update the orchestration state, only the new events will be written. It also allows us to do interesting things, like caching where we can skip getting all historic events, and just fetch pending events from the database. With this, the overhead of replay is avoided, which means long‐ running orchestrations from workflows with more steps are less of a concern.
-- new table to store execution state
CREATE TABLE tbl_OrchestrationSessionEvent (
   ...
   SessionId       BIGINT          NOT NULL,
   EventId         BINARY(20)      NOT NULL,
   EventData       VARBINARY(MAX)  NOT NULL
)
Impact
On GitHub.com, we saw CPU consumption for running orchestrations reduced by 50% on average, with longer-running orchestrations seeing a larger benefit. We hadn’t made much investment in the orchestration platform we depend on before making this change. The result from the change showed the importance of constantly reevaluating our approaches and underlying platforms as we grow and evolve.
Fix 3: Reducing postback load
What is a postback
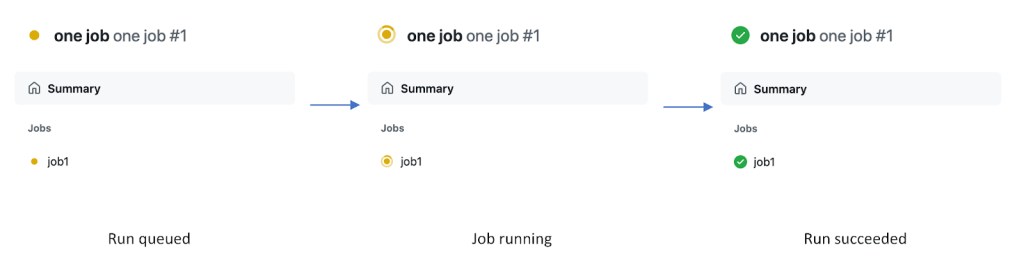
As a workflow run progresses, you can see the updates as checks in the UI and API. The state of a run is kept by the GitHub Actions backend service (in orchestration), but the checks for a run are kept in the Rails monolith. Simply put, a “postback” is the service-to-service call that pushes the latest run state to checks. Postbacks are generated as the orchestrator executes a workflow run. The backend maintains an internal queue of postbacks to send to the frontend using a separate orchestration per workflow run so they are reliable and won’t get interrupted by service downtime.
During load testing, we found that delivering a postback is consistently one of the slower activities, averaging around 250-300ms to execute. We also discovered that the backend sends one postback for every check step update and three postbacks with almost exactly the same payload whenever a check run completes. A large amount of slow postbacks consumes a lot of system resources and can stall execution of other activities, causing overall slowness. This was especially concerning for large matrix scenarios.
What we did instead
We evaluated the usefulness of every postback the backend sends. We found that check step statuses are only displayed on one specific UI. We decided to stop sending them during the workflow run and post step data only upon completion of the run. Not having step data available for in-progress runs meant that the initial navigation speed for an in-progress run could be slower than that of a completed run due to client side rendering overhead, but those are tradeoffs we were willing to make. Of course, we also removed the duplicated job completed events. Both of these changes shipped with GHES 3.3 that allowed GitHub Actions to run close to 2x more jobs concurrently than GHES 3.2.
As for slowness of each individual postback call, they are slow because postbacks were being sent via HTTP calls across four different services with each service manually handling retries, timeouts, etc. We are actively working on switching postback delivery to a faster and simpler system using a message queue. The goal is to roll out the change in the next few months, hopefully increasing performance further.
In conclusion
Of course, there are other improvements we made that didn’t make it to this post (it’s long enough already). In the end, GitHub Actions can now run three times more jobs concurrently while using less system resources. And while work like this is satisfying to us as engineers—3x is a big improvement!—we also know that this has real-world impact on our customers who rely on GitHub Actions to get their work done and deliver code into production. We learned that it’s always worthwhile to revisit fundamentals on longstanding projects, especially as they scale. Going forward, we’re looking to continue improving our load testing automation to catch issues like the ones mentioned above before they become problems and to continue optimizing performance across the GitHub platform.
Tags:
Written by

Related posts

The cost of saying yes has changed
The cost of writing code dropped; the cost of owning it didn’t. A framework for deciding which changes are actually cheap in the AI era.
Better tools made Copilot code review worse. Here’s how we actually improved it.
How migrating Copilot code review to shared Unix-style code exploration tools reduced review cost by reshaping agent workflows around pull request evidence.
Automating cross-repo documentation with GitHub Agentic Workflows
Explore how the Aspire team turns merged product changes into SME-reviewed docs pull requests, closing the gap between release and documentation.