October 21 post-incident analysis
In-depth analysis of the incident that impacted GitHub services on October 21 and 22.

Last week, GitHub experienced an incident that resulted in degraded service for 24 hours and 11 minutes. While portions of our platform were not affected by this incident, multiple internal systems were affected which resulted in our displaying of information that was out of date and inconsistent. Ultimately, no user data was lost; however manual reconciliation for a few seconds of database writes is still in progress. For the majority of the incident, GitHub was also unable to serve webhook events or build and publish GitHub Pages sites.
All of us at GitHub would like to sincerely apologize for the impact this caused to each and every one of you. We’re aware of the trust you place in GitHub and take pride in building resilient systems that enable our platform to remain highly available. With this incident, we failed you, and we are deeply sorry. While we cannot undo the problems that were created by GitHub’s platform being unusable for an extended period of time, we can explain the events that led to this incident, the lessons we’ve learned, and the steps we’re taking as a company to better ensure this doesn’t happen again.
Background
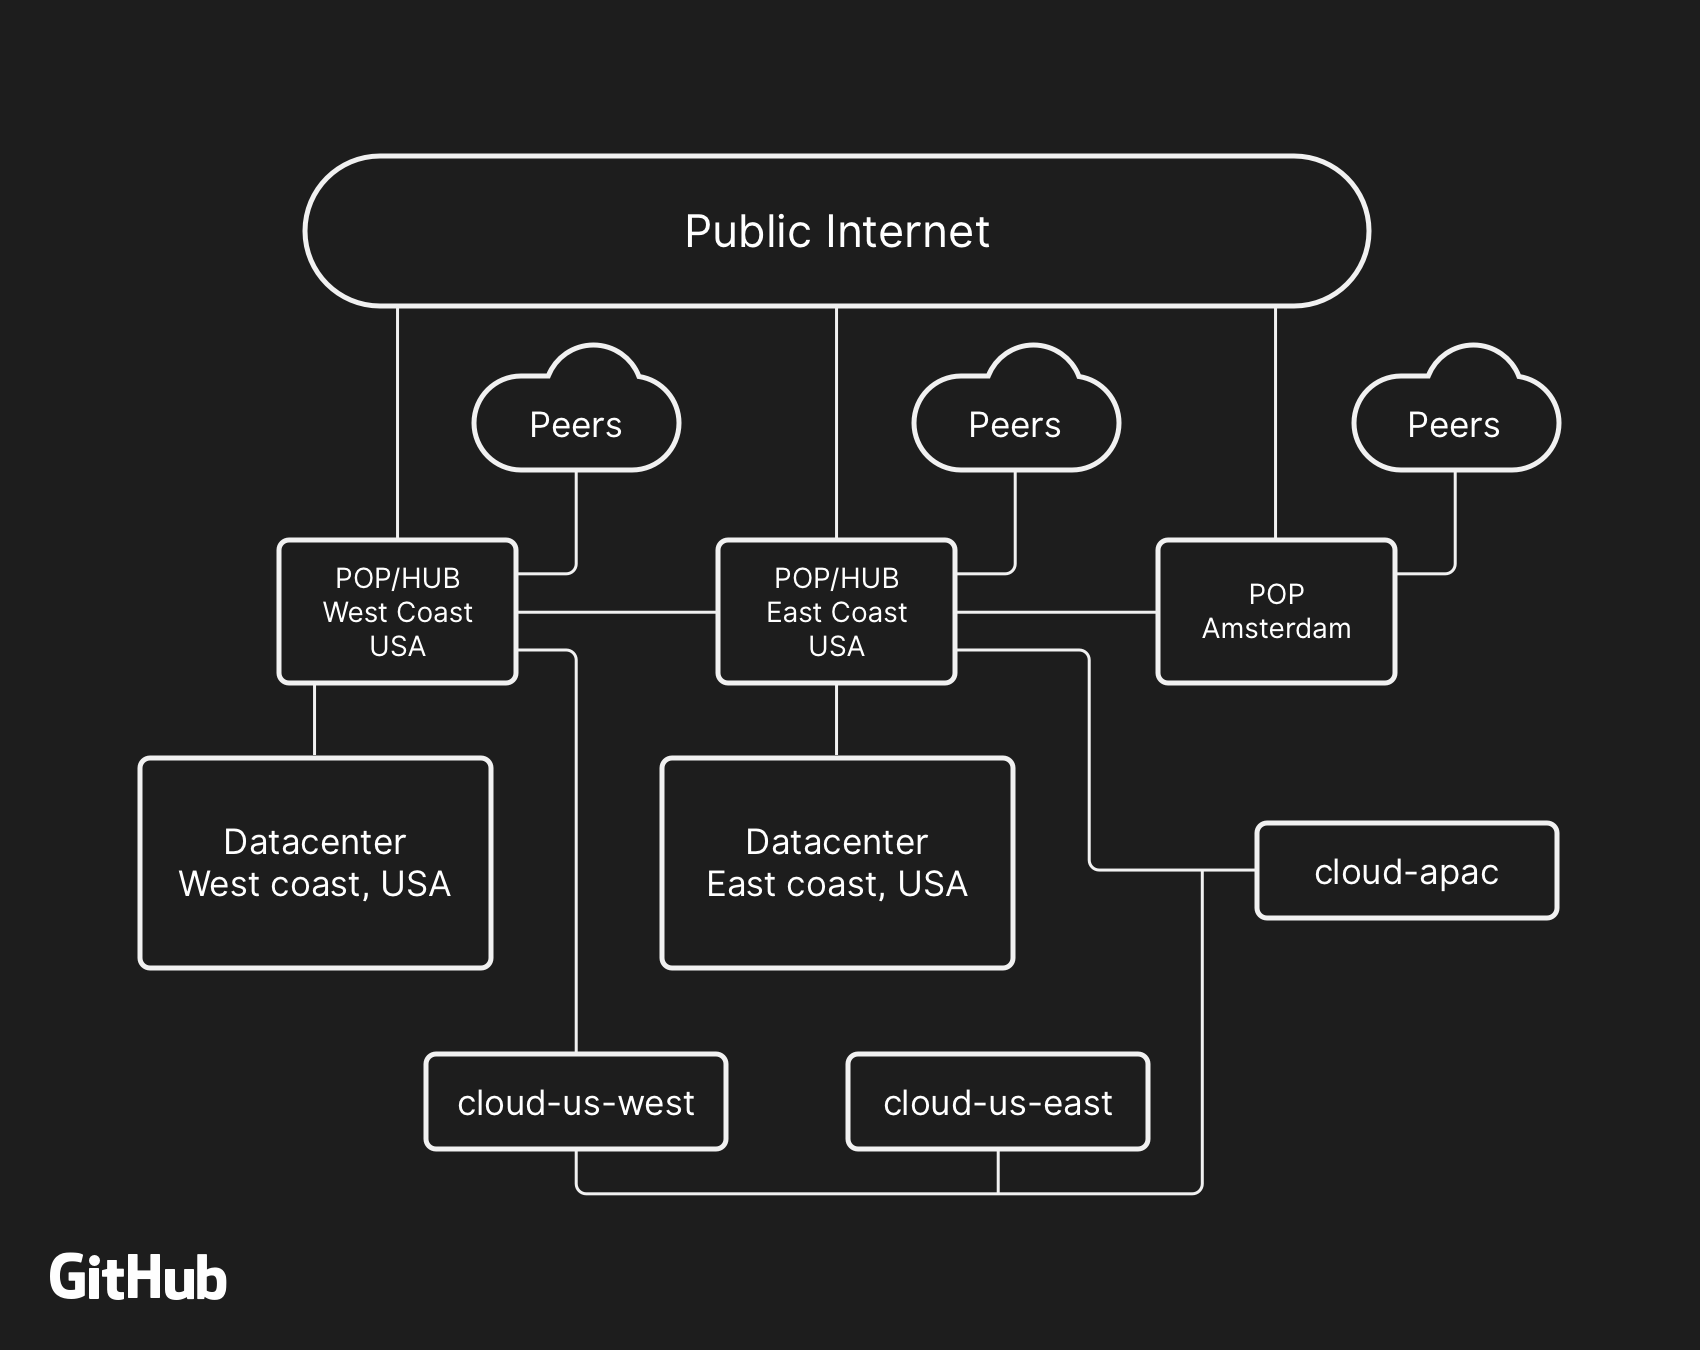
The majority of user-facing GitHub services are run within our own data center facilities. The data center topology is designed to provide a robust and expandable edge network that operates in front of several regional data centers that power our compute and storage workloads. Despite the layers of redundancy built into the physical and logical components in this design, it is still possible that sites will be unable to communicate with each other for some amount of time.
At 22:52 UTC on October 21, routine maintenance work to replace failing 100G optical equipment resulted in the loss of connectivity between our US East Coast network hub and our primary US East Coast data center. Connectivity between these locations was restored in 43 seconds, but this brief outage triggered a chain of events that led to 24 hours and 11 minutes of service degradation.
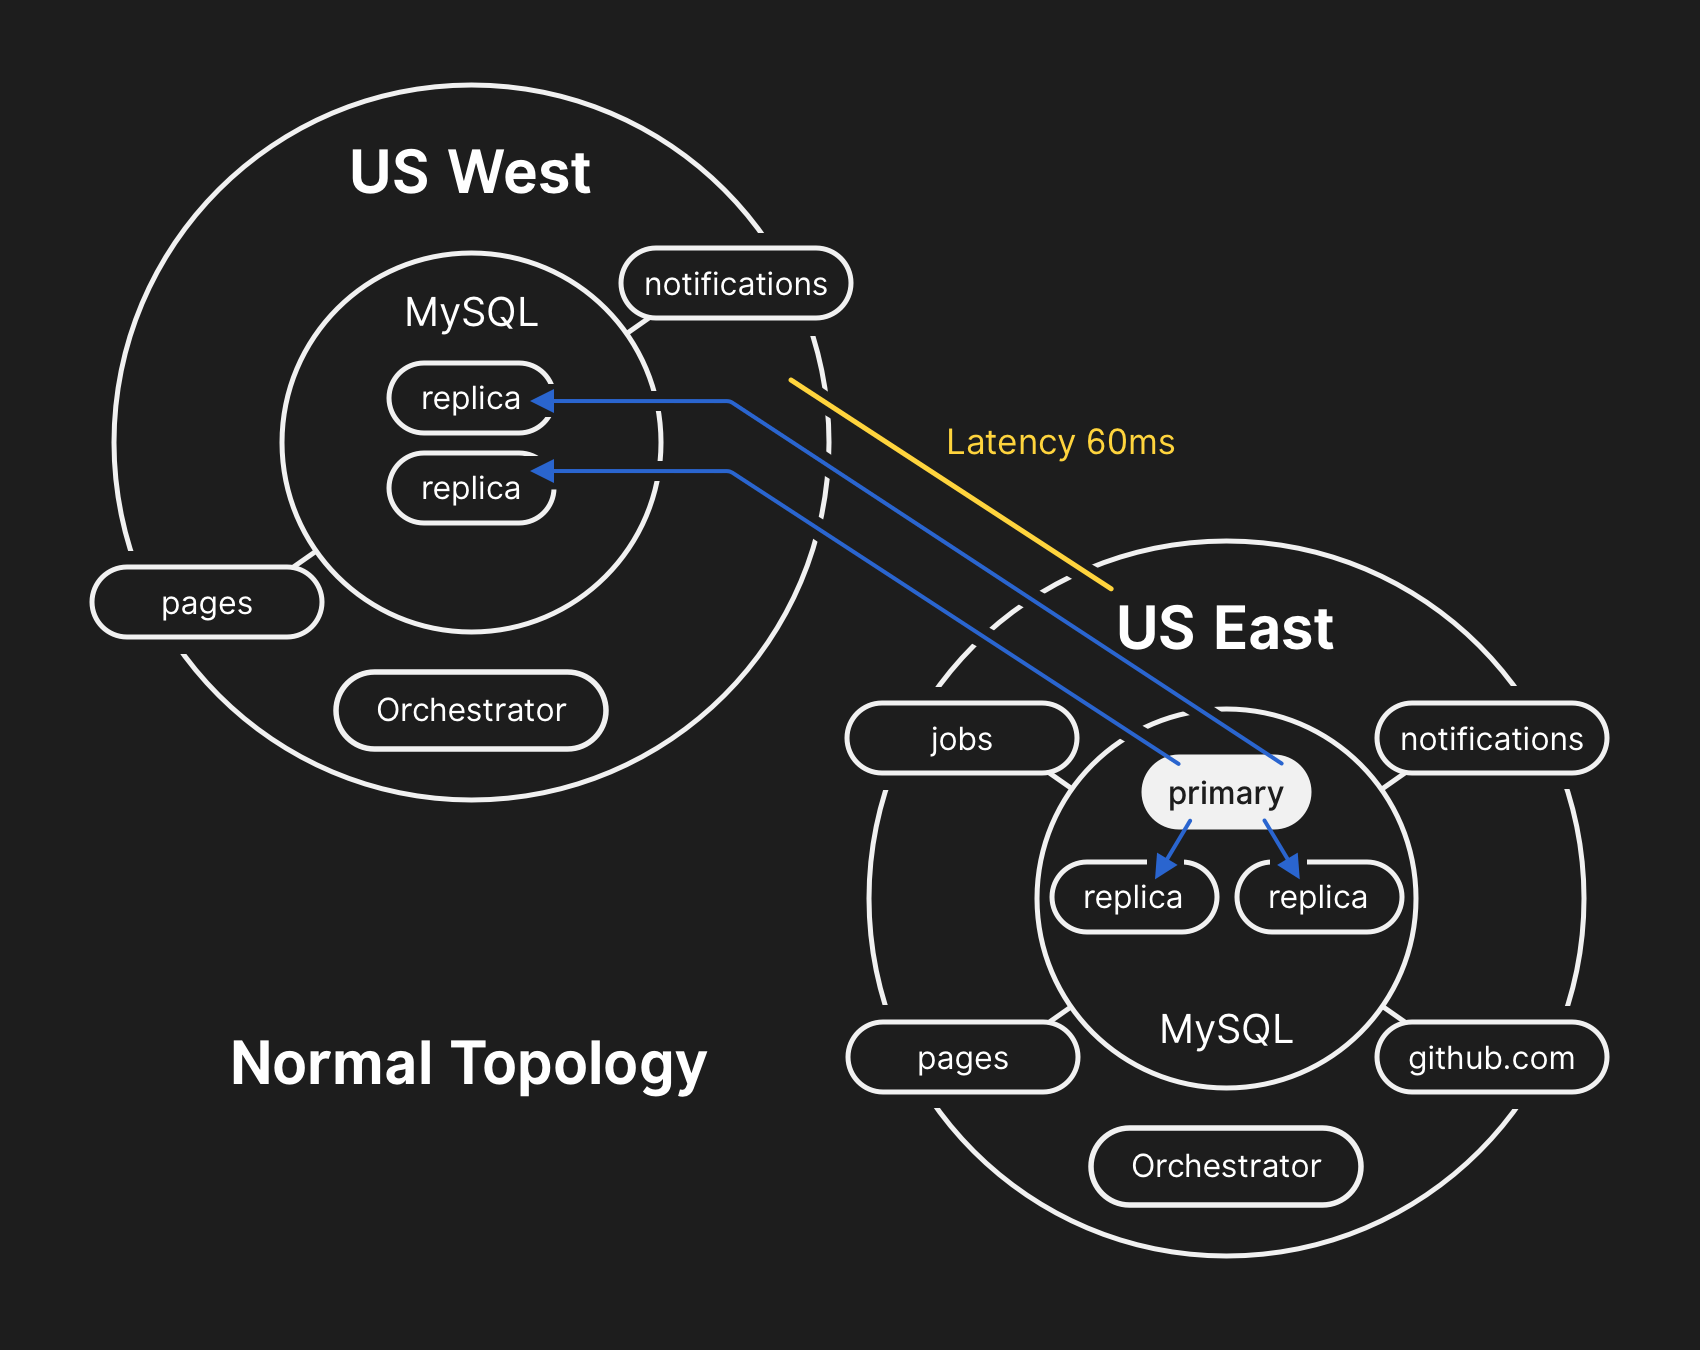
In the past, we’ve discussed how we use MySQL to store GitHub metadata as well as our approach to MySQL High Availability. GitHub operates multiple MySQL clusters varying in size from hundreds of gigabytes to nearly five terabytes, each with up to dozens of read replicas per cluster to store non-Git metadata, so our applications can provide pull requests and issues, manage authentication, coordinate background processing, and serve additional functionality beyond raw Git object storage. Different data across different parts of the application is stored on various clusters through functional sharding.
To improve performance at scale, our applications will direct writes to the relevant primary for each cluster, but delegate read requests to a subset of replica servers in the vast majority of cases. We use Orchestrator to manage our MySQL cluster topologies and handle automated failover. Orchestrator considers a number of variables during this process and is built on top of Raft for consensus. It’s possible for Orchestrator to implement topologies that applications are unable to support, therefore care must be taken to align Orchestrator’s configuration with application-level expectations.
Incident timeline
2018 October 21 22:52 UTC
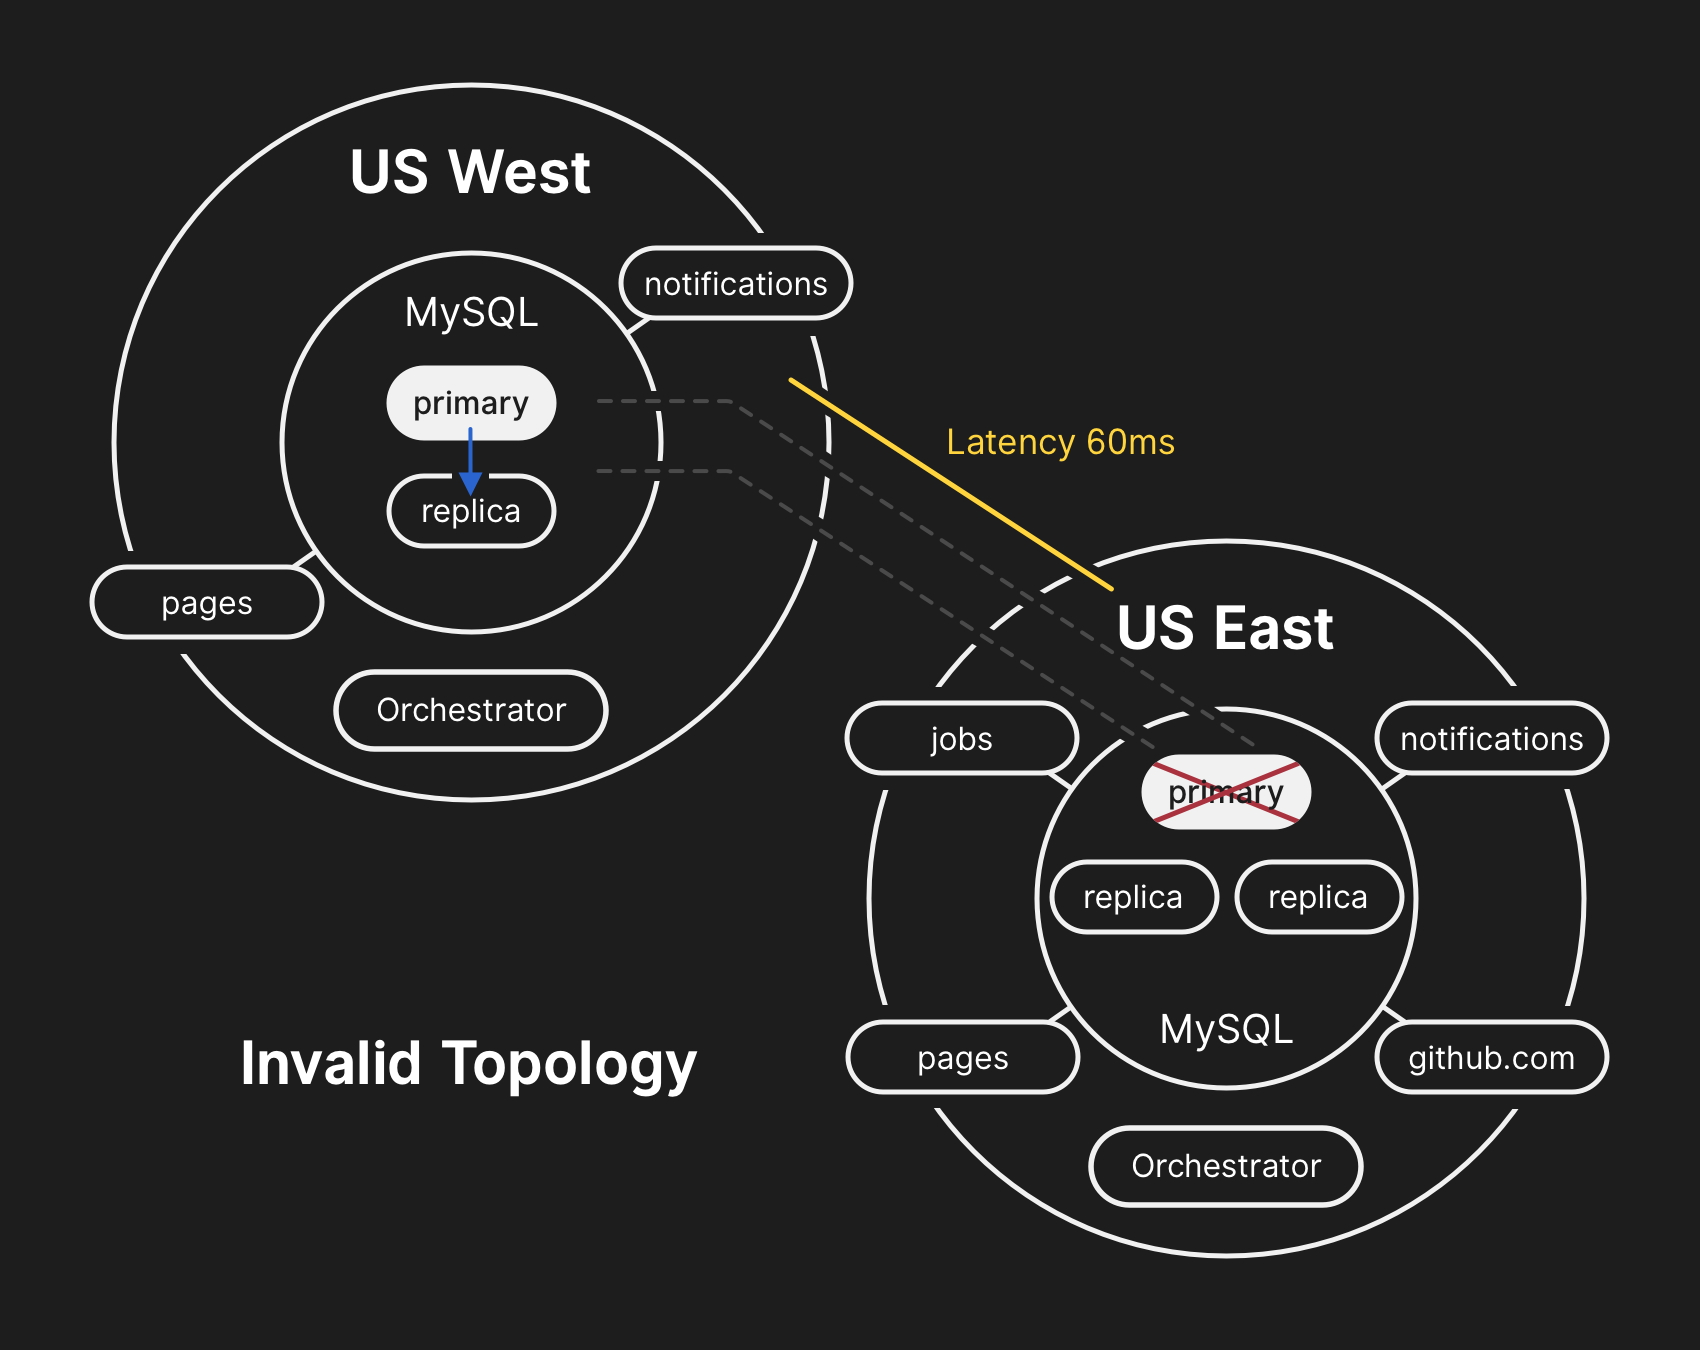
During the network partition described above, Orchestrator, which had been active in our primary data center, began a process of leadership deselection, according to Raft consensus. The US West Coast data center and US East Coast public cloud Orchestrator nodes were able to establish a quorum and start failing over clusters to direct writes to the US West Coast data center. Orchestrator proceeded to organize the US West Coast database cluster topologies. When connectivity was restored, our application tier immediately began directing write traffic to the new primaries in the West Coast site.
The database servers in the US East Coast data center contained a brief period of writes that had not been replicated to the US West Coast facility. Because the database clusters in both data centers now contained writes that were not present in the other data center, we were unable to fail the primary back over to the US East Coast data center safely.
2018 October 21 22:54 UTC
Our internal monitoring systems began generating alerts indicating that our systems were experiencing numerous faults. At this time there were several engineers responding and working to triage the incoming notifications. By 23:02 UTC, engineers in our first responder team had determined that topologies for numerous database clusters were in an unexpected state. Querying the Orchestrator API displayed a database replication topology that only included servers from our US West Coast data center.
2018 October 21 23:07 UTC
By this point the responding team decided to manually lock our internal deployment tooling to prevent any additional changes from being introduced. At 23:09 UTC, the responding team placed the site into yellow status. This action automatically escalated the situation into an active incident and sent an alert to the incident coordinator. At 23:11 UTC the incident coordinator joined and two minutes later made the decision change to status red.
2018 October 21 23:13 UTC
It was understood at this time that the problem affected multiple database clusters. Additional engineers from GitHub’s database engineering team were paged. They began investigating the current state in order to determine what actions needed to be taken to manually configure a US East Coast database as the primary for each cluster and rebuild the replication topology. This effort was challenging because by this point the West Coast database cluster had ingested writes from our application tier for nearly 40 minutes. Additionally, there were the several seconds of writes that existed in the East Coast cluster that had not been replicated to the West Coast and prevented replication of new writes back to the East Coast.
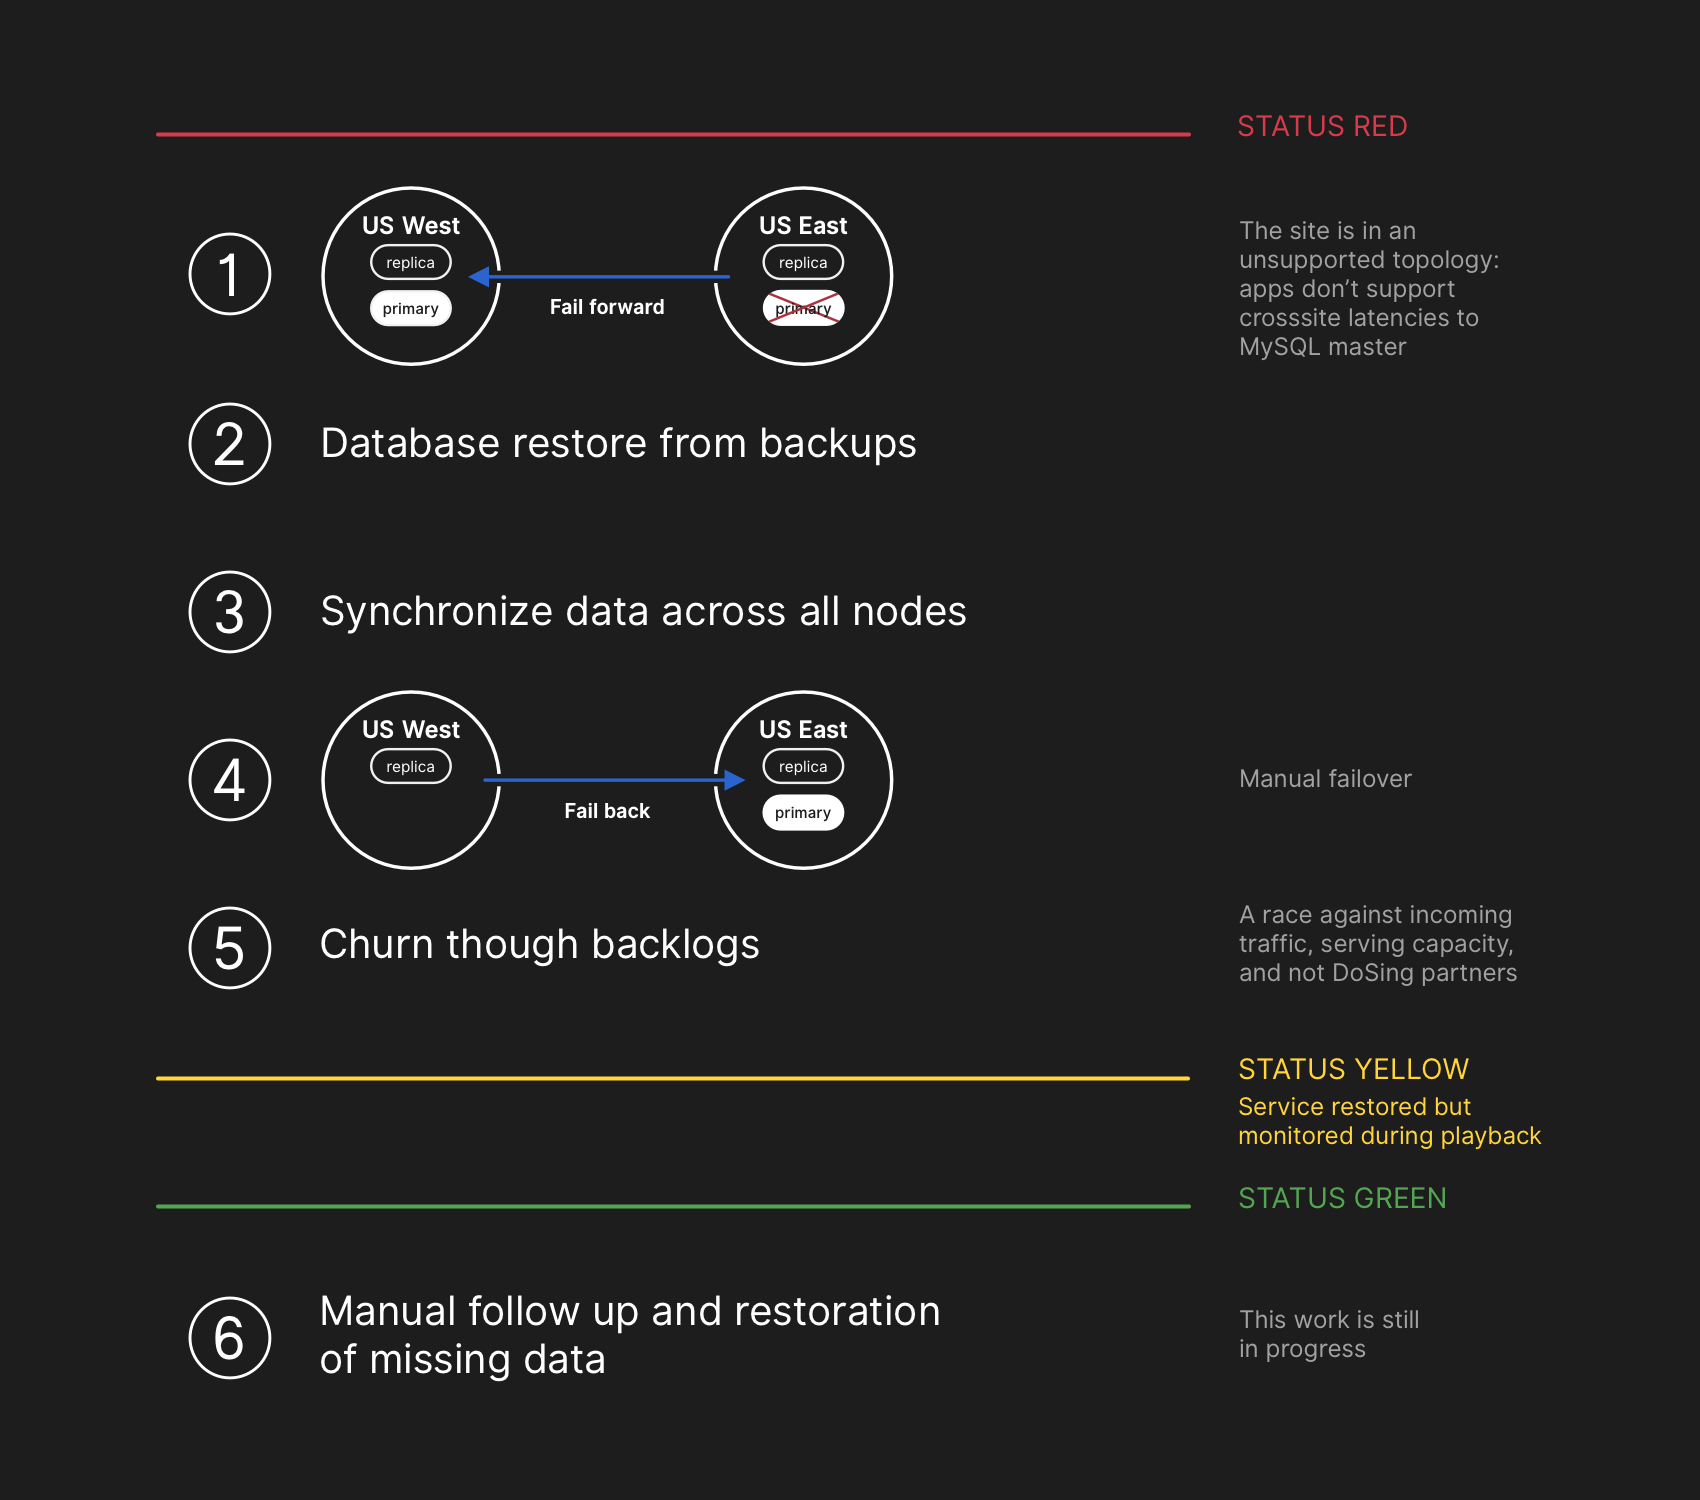
Guarding the confidentiality and integrity of user data is GitHub’s highest priority. In an effort to preserve this data, we decided that the 30+ minutes of data written to the US West Coast data center prevented us from considering options other than failing-forward in order to keep user data safe. However, applications running in the East Coast that depend on writing information to a West Coast MySQL cluster are currently unable to cope with the additional latency introduced by a cross-country round trip for the majority of their database calls. This decision would result in our service being unusable for many users. We believe that the extended degradation of service was worth ensuring the consistency of our users’ data.
2018 October 21 23:19 UTC
It was clear through querying the state of the database clusters that we needed to stop running jobs that write metadata about things like pushes. We made an explicit choice to partially degrade site usability by pausing webhook delivery and GitHub Pages builds instead of jeopardizing data we had already received from users. In other words, our strategy was to prioritize data integrity over site usability and time to recovery.
2018 October 22 00:05 UTC
Engineers involved in the incident response team began developing a plan to resolve data inconsistencies and implement our failover procedures for MySQL. Our plan was to restore from backups, synchronize the replicas in both sites, fall back to a stable serving topology, and then resume processing queued jobs. We updated our status to inform users that we were going to be executing a controlled failover of an internal data storage system.
While MySQL data backups occur every four hours and are retained for many years, the backups are stored remotely in a public cloud blob storage service. The time required to restore multiple terabytes of backup data caused the process to take hours. A significant portion of the time was consumed transferring the data from the remote backup service. The process to decompress, checksum, prepare, and load large backup files onto newly provisioned MySQL servers took the majority of time. This procedure is tested daily at minimum, so the recovery time frame was well understood, however until this incident we have never needed to fully rebuild an entire cluster from backup and had instead been able to rely on other strategies such as delayed replicas.
2018 October 22 00:41 UTC
A backup process for all affected MySQL clusters had been initiated by this time and engineers were monitoring progress. Concurrently, multiple teams of engineers were investigating ways to speed up the transfer and recovery time without further degrading site usability or risking data corruption.
2018 October 22 06:51 UTC
Several clusters had completed restoration from backups in our US East Coast data center and begun replicating new data from the West Coast. This resulted in slow site load times for pages that had to execute a write operation over a cross-country link, but pages reading from those database clusters would return up-to-date results if the read request landed on the newly restored replica. Other larger database clusters were still restoring.
Our teams had identified ways to restore directly from the West Coast to overcome throughput restrictions caused by downloading from off-site storage and were increasingly confident that restoration was imminent, and the time left to establishing a healthy replication topology was dependent on how long it would take replication to catch up. This estimate was linearly interpolated from the replication telemetry we had available and the status page was updated to set an expectation of two hours as our estimated time of recovery.
2018 October 22 07:46 UTC
GitHub published a blog post to provide more context. We use GitHub Pages internally and all builds had been paused several hours earlier, so publishing this took additional effort. We apologize for the delay. We intended to send this communication out much sooner and will be ensuring we can publish updates in the future under these constraints.
2018 October 22 11:12 UTC
All database primaries established in US East Coast again. This resulted in the site becoming far more responsive as writes were now directed to a database server that was co-located in the same physical data center as our application tier. While this improved performance substantially, there were still dozens of database read replicas that were multiple hours delayed behind the primary. These delayed replicas resulted in users seeing inconsistent data as they interacted with our services. We spread the read load across a large pool of read replicas and each request to our services had a good chance of hitting a read replica that was multiple hours delayed.
In reality, the time required for replication to catch up had adhered to a power decay function instead of a linear trajectory. Due to increased write load on our database clusters as users woke up and began their workday in Europe and the US, the recovery process took longer than originally estimated.
2018 October 22 13:15 UTC
By now, we were approaching peak traffic load on GitHub.com. A discussion was had by the incident response team on how to proceed. It was clear that replication delays were increasing instead of decreasing towards a consistent state. We’d begun provisioning additional MySQL read replicas in the US East Coast public cloud earlier in the incident. Once these became available it became easier to spread read request volume across more servers. Reducing the utilization in aggregate across the read replicas allowed replication to catch up.
2018 October 22 16:24 UTC
Once the replicas were in sync, we conducted a failover to the original topology, addressing the immediate latency/availability concerns. As part of a conscious decision to prioritize data integrity over a shorter incident window, we kept the service status red while we began processing the backlog of data we had accumulated.
2018 October 22 16:45 UTC
During this phase of the recovery, we had to balance the increased load represented by the backlog, potentially overloading our ecosystem partners with notifications, and getting our services back to 100% as quickly as possible. There were over five million hook events and 80 thousand Pages builds queued.
As we re-enabled processing of this data, we processed ~200,000 webhook payloads that had outlived an internal TTL and were dropped. Upon discovering this, we paused that processing and pushed a change to increase that TTL for the time being.
To avoid further eroding the reliability of our status updates, we remained in degraded status until we had completed processing the entire backlog of data and ensured that our services had clearly settled back into normal performance levels.
2018 October 22 23:03 UTC
All pending webhooks and Pages builds had been processed and the integrity and proper operation of all systems had been confirmed. The site status was updated to green.
Next steps
Resolving data inconsistencies
During our recovery, we captured the MySQL binary logs containing the writes we took in our primary site that were not replicated to our West Coast site from each affected cluster. The total number of writes that were not replicated to the West Coast was relatively small. For example, one of our busiest clusters had 954 writes in the affected window. We are currently performing an analysis on these logs and determining which writes can be automatically reconciled and which will require outreach to users. We have multiple teams engaged in this effort, and our analysis has already determined a category of writes that have since been repeated by the user and successfully persisted. As stated in this analysis, our primary goal is preserving the integrity and accuracy of the data you store on GitHub.
Communication
In our desire to communicate meaningful information to you during the incident, we made several public estimates on time to repair based on the rate of processing of the backlog of data. In retrospect, our estimates did not factor in all variables. We are sorry for the confusion this caused and will strive to provide more accurate information in the future.
Technical initiatives
There are a number of technical initiatives that have been identified during this analysis. As we continue to work through an extensive post-incident analysis process internally, we expect to identify even more work that needs to happen.
- Adjust the configuration of Orchestrator to prevent the promotion of database primaries across regional boundaries. Orchestrator’s actions behaved as configured, despite our application tier being unable to support this topology change. Leader-election within a region is generally safe, but the sudden introduction of cross-country latency was a major contributing factor during this incident. This was emergent behavior of the system given that we hadn’t previously seen an internal network partition of this magnitude.
- We have accelerated our migration to a new status reporting mechanism that will provide a richer forum for us to talk about active incidents in crisper and clearer language. While many portions of GitHub were available throughout the incident, we were only able to set our status to green, yellow, and red. We recognize that this doesn’t give you an accurate picture of what is working and what is not, and in the future will be displaying the different components of the platform so you know the status of each service.
- In the weeks prior to this incident, we had started a company-wide engineering initiative to support serving GitHub traffic from multiple data centers in an active/active/active design. This project has the goal of supporting N+1 redundancy at the facility level. The goal of that work is to tolerate the full failure of a single data center failure without user impact. This is a major effort and will take some time, but we believe that multiple well-connected sites in a geography provides a good set of trade-offs. This incident has added urgency to the initiative.
- We will take a more proactive stance in testing our assumptions. GitHub is a fast growing company and has built up its fair share of complexity over the last decade. As we continue to grow, it becomes increasingly difficult to capture and transfer the historical context of trade-offs and decisions made to newer generations of Hubbers.
Organizational initiatives
This incident has led to a shift in our mindset around site reliability. We have learned that tighter operational controls or improved response times are insufficient safeguards for site reliability within a system of services as complicated as ours. To bolster those efforts, we will also begin a systemic practice of validating failure scenarios before they have a chance to affect you. This work will involve future investment in fault injection and chaos engineering tooling at GitHub.
Conclusion
We know how much you rely on GitHub for your projects and businesses to succeed. No one is more passionate about the availability of our services and the correctness of your data. We will continue to analyze this event for opportunities to serve you better and earn the trust you place in us.
Written by

Related posts

GitHub availability report: June 2026
In June, we experienced six incidents that resulted in degraded performance across GitHub services.

Q1 2026 Innovation Graph update: Open source collaboration is accelerating worldwide
New Innovation Graph data shows global developer communities growing faster than ever, with collaboration reaching new highs across many economies.
GitHub joins coalition advocating for fixes to California AI Transparency Act to protect open source
We’re calling for targeted amendments to resolve conflicts with open source licensing and align with international transparency frameworks while preserving regulatory intent.