Mitigating replication lag and reducing read load with freno
At GitHub, we use MySQL as the main database technology backing our services. We run classic MySQL master-replica setups, where writes go to the master, and replicas replay master’s changes asynchronously. To be able to serve our traffic we read data from the MySQL replicas.
At GitHub, we use MySQL as the main database technology backing our services. We run classic MySQL master-replica setups, where writes go to the master, and replicas replay master’s changes asynchronously. To be able to serve our traffic we read data from the MySQL replicas. To scale our traffic we may add more replica servers. Reading from the master does not scale and we prefer to minimize master reads.
With asynchronous replication, changes we make to the master are not immediately reflected on replicas. Each replica pulls changes from its master and replays them as fast as it can. There is a nonzero delay between the point in time where changes are made visible on a master and the time where those changes are visible on some replica or on all replicas. This delay is the replication lag.
The higher the replication lag on a host, the more stale its data becomes. Serving traffic off of a lagging replica leads to poor user experience, as someone may make a change and then not see it reflected. Our automation removes lagging replicas from the serving pool after a few seconds, but even those few seconds matter: we commonly expect sub-second replication lag.
Maintaining low replication lag is challenging. An occasional INSERT or UPDATE is nothing, but we routinely run massive updates to our databases. These could be batched jobs, cleanup tasks, schema changes, schema change followups or otherwise operations that affect large datasets. Such large operations may easily introduce replication lag: while a replica is busy applying a change to some 100,000 rows, its data quickly becomes stale, and by the time it completes processing it’s already lagging and requires even more time to catch up.
Running subtasks
To mitigate replication lag for large operations we use batching. We never apply a change to 100,000 rows all at once. Any big update is broken into small segments, subtasks, of some 50 or 100 rows each.
As an example, say our app needs to purge some rows that satisfy a condition from a very large table. Instead of running a single DELETE FROM my_table WHERE some_condition = 1 we break the query to smaller subqueries, each operating on a different slice of the table. In its purest form, we would get a sequence of queries such as:
DELETE FROM my_table WHERE some_condition = 1 AND (id >= 0 AND id < 100);
DELETE FROM my_table WHERE some_condition = 1 AND (id >= 100 AND id < 200);
DELETE FROM my_table WHERE some_condition = 1 AND (id >= 200 AND id < 300);
DELETE FROM my_table WHERE some_condition = 1 AND (id >= 300 AND id < 400);
DELETE FROM my_table WHERE some_condition = 1 AND (id >= 400 AND id < 500);
...
These smaller queries can each be processed by a replica very quickly, making it available to process more events, some of which may be the normal site’s update traffic or the next segments.
However, the numbers still add up. On a busy hour a heavily loaded replica may still find it too difficult to manage both read traffic and massive changes coming from the replication stream.
Throttling
We recognize that most of the large volume operations come from background jobs, such as archiving or schema migrations. There is no particular user of API requests waiting on those operations to complete. It is fine for these operations to take a little while longer to complete.
In order to apply these large operations, we break them into smaller segments and throttle in between applying those segments. Each segment is small enough and safe to send down the replication stream, but a bunch of those segments can be too much for the replicas to handle. In between each segment we pause and ask: is replication happy and in good shape?
There is no direct mechanism in MySQL to do that. Closest would be semisynchronous replication, but even that doesn’t guarantee replication lag to be caught up nor be within reasonable margins.
It is up to us to be able to identify our relevant production traffic serving replicas and ask: “What is your current lag?”
If lag on all relevant replicas is within good margins (we expect subsecond), we proceed to run the next segment, then ask again. If lag is higher than desired, we throttle: we stall the operation, and keep polling lag until we’re satisfied it is low enough for us.
This flow suggests:
- The app needs a way to identify production serving replicas.
- The app needs to be able to gather lag information from those replicas.
- It needs to do so from whatever hosts it’s running on, and potentially from multiple hosts concurrently.
The old GitHub throttler
Our site runs Ruby on Rails. Over time, we built into our Rails app a series of abstractions to identify the set of replicas that were active in a cluster, ask them their current replication delay value, and determine whether that value was
low enough to continue writing on the master. In its simplest form, the api looks like this:
big_dataset.each_slice do |subset|
  GitHub::Throttler::MyCluster.throttle do
    write(subset)
  end
end
We would routinely inspect HAProxy for the list relevant replicas and populate a special table with that list. The table was made available to the throttler.
When .throttle was called, the throttler pulled the list of replicas and polled replication delay metrics from the MySQL servers.
A common tool part of Percona Toolkit called pt-heartbeat inserts a timestamp each 100ms in the master. That timestamp is replicated along with the rest of the information to the replicas, and as a consequence, the following query returns the replication delay in seconds from each of the replicas.
select unix_timestamp(now(6)) - unix_timestamp(ts) as replication_delay from heartbeat order by ts desc limit 1The aggregated value of replication delay was the maximum of the different metrics polled from each replica.
The throttler also had local configuration to determine when that aggregated value was low-enough. If it wasn’t, the code block above would sleep for a second and check the replication delay again; if it instead was good, it would run the block, thus writing the subset.
Non ruby throttlers
As we’ve grown, we’ve introduced write workloads outside of our main Rails application, and they’ve needed to be throttled as well.
We routinely archive or purge old data via pt-archiver. This is a Perl script, and fortunately comes with its own implementation for replication lag based throttling. The tool crawls down the topology to find replicating servers, then periodically checks their replication lag.
Last year we introduced gh-ost, our schema migration tool. gh-ost, by definition, runs our most massive operations: it literally rebuilds and rewrites entire tables. Even if not throttled, some of our tables could take hours or days to rebuild. gh-ost is written in Go, and could not use the Ruby throttler implementation nor the Perl implementation. Nor did we wish for it to depend on either, as we created it as a general purpose, standalone solution to be used by the community. gh-ost runs its own throttling mechanism, checking first and foremost the very replica on which it operates, but then also the list of --throttle-control-replicas. gh-ost‘s interactive commands allow us to change the list of throttle control replicas during runtime. We would compute the list dynamically when spawning gh-ost, and update, if needed, during migration.
Then Spokes brought more massive writes. As our infrastructure grew, more and more external Ruby and non-Ruby services began running massive operations on our database.
An operational anti-pattern
What used to work well when we were running exclusively Ruby on Rails code and in smaller scale didn’t work so well as we grew. We increasingly ran into operational issues with our throttling mechanisms.
We were running more and more throttling tasks, many in parallel. We were also provisioning, decommissioning, and refactoring our MySQL fleets. Our traffic grew substantially. We realized our throttling setups had limitations.
Different apps were getting the list of relevant replicas in different ways. While the Ruby throttler always kept an updated list, we’d need to educate pt-archiver and gh-ost about an initial list, duplicating the logic the Ruby throttler would use. And while the Ruby throttler found out in real time about list changes (provisioning, decommissioning servers in production), gh-ost had to be told about such changes, and pt-archiver‘s list was immutable; we’d need to kill it and restart the operation for it to consider a different list. Other apps were mostly trying to operate similarly to the Ruby throttler, but never exactly.
As result, different apps would react differently to ongoing changes. One app would be able to gain the upper hand on another, running its own massive operation while starving the other.
The databases team members would have more complicated playbooks, and would need to run manual commands when changing our rosters. More importantly, the database team had no direct control of the apps. We would be able to cheat the apps into throttling if we wanted to, but it was all-or-nothing: either we would throttle everything or we would throttle nothing. Occasionally we would like to prioritize one operation over another, but had no way to do that.
The Ruby throttler provided great metric collection, but the other tools did not; or didn’t integrate well with the GitHub infrastructure, and we didn’t have visibility into what was being throttled and why.
We were wasting resources. The Ruby throttler would probe the MySQL replicas synchronously and sequentially per server host. Each throttle check by the app would introduce a latency to the operation by merely iterating the MySQL fleet, a wasted effort if no actual lag was found. It invoked the check for each request, which implied dozens of calls per second. That many duplicate calls were wasteful. As result we would see dozens or even hundreds of stale connections on our replica servers made by the throttler from various endpoints, either querying for lag or sleeping.
Introducing freno
We built freno, GitHub’s central throttling service, to replace all our existing throttling mechanisms and solve the operational issues and limitations described above.

freno is Spanish for brake, as in car brakes. The name throttled was already taken and freno was just the next most sensible name.
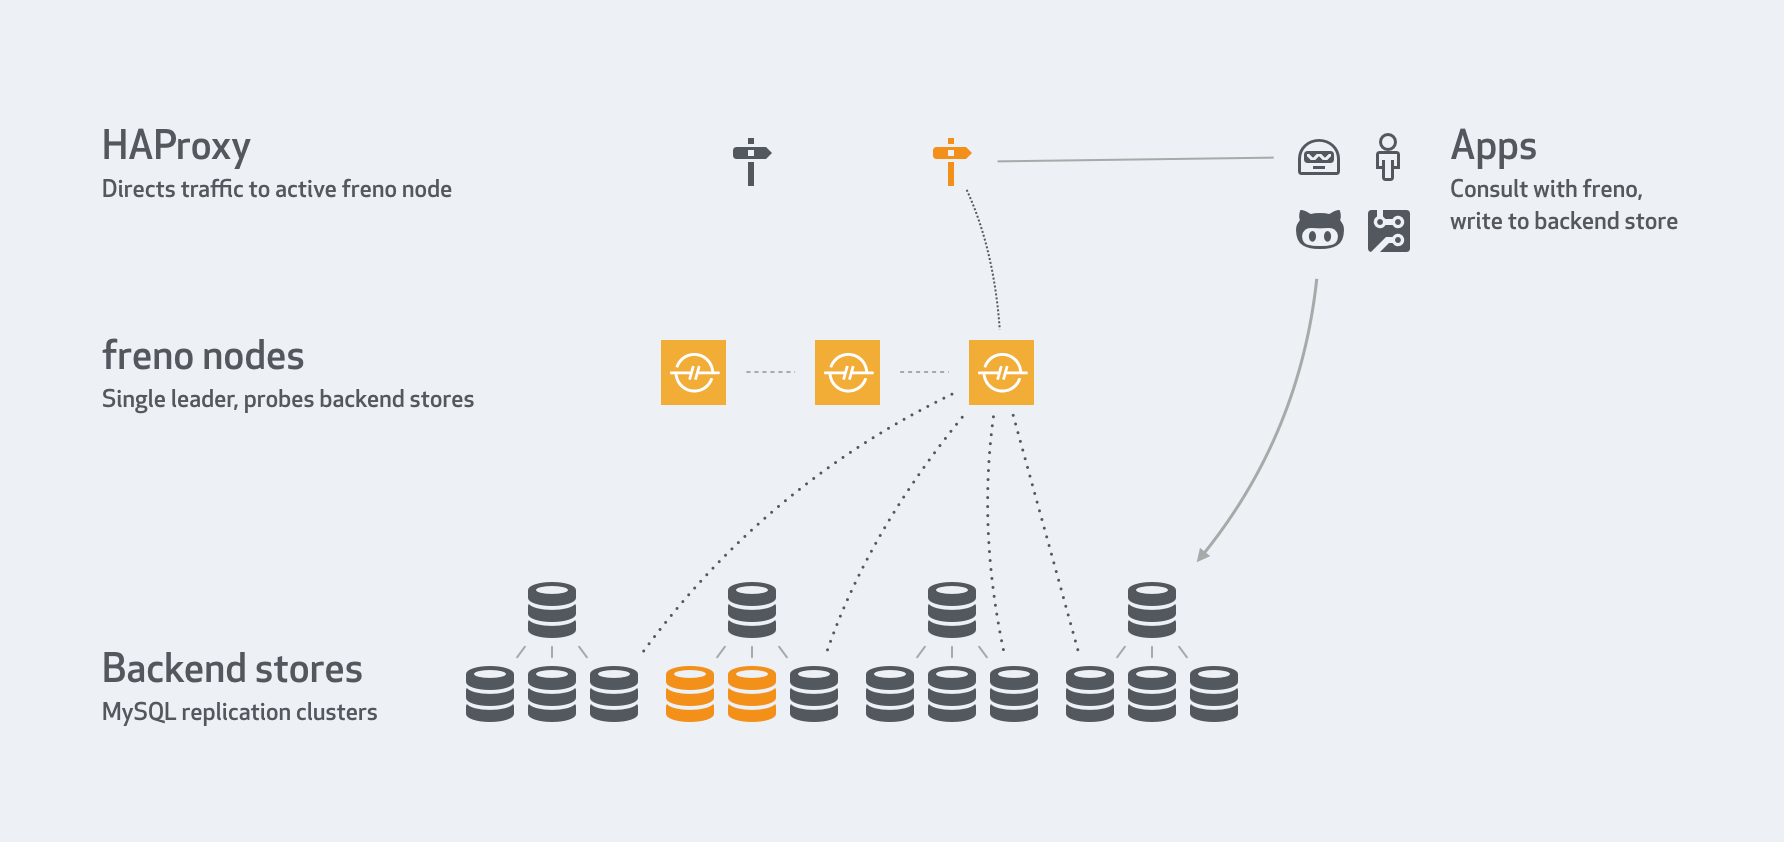
In its very basic essence, freno runs as a standalone service that understands replication lag status and can make recommendations to inquiring apps. However, let’s consider some of its key design and operational principles:
Continuous polls
freno continuously probes and queries the MySQL replicas. It does so independently of any app wanting to issue writes. It does so asynchronously to any app.
Knowledgable
freno continuously updates the list of servers per cluster. Within a 10 second timeframe freno will recognize that servers were removed or added. In our infrastructure, freno polls our GLB servers (seen as HAProxy) to get the roster of production replicas.
An app doesn’t need to (and actually just doesn’t) know the identity of backend servers, their count or location. It just needs to know the cluster it wants to write to.
Highly available
Multiple freno services form a raft cluster. Depending on cluster size some boxes can go down and still the freno service would be up, with a leader to serve traffic. Our proxies direct traffic to the freno leader (we have highly available proxies setup, but one may also detect the leader’s identity directly).
Cooperative
freno use is voluntary. It is not a proxy to the MySQL servers, and it has no power over the applications. It provides recommendations to applications that are interested in replication lag status. Those applications are expected to cooperate with freno‘s recommendations.
An app issues a HEAD request to freno, and gets a 200 OK when it is clear to write, or a different code when it should throttle.
Throttle control
We are able to throttle specific apps, for a predefined duration and to a predefined degree. For example, an engineer can issue the following in chat:
We may altogether refuse an app’s requests or only let it operate in low volumes.
Metrics
freno records all requests by all apps. We are able to see which app requested writes to which cluster and when. We know when it was granted access and when it was throttled.
Visibility
We are able to query freno and tell which metric hasn’t been healthy in the past 10 minutes, or who requested writes to a particular cluster, or what is being forcefully throttled, or what would be the response right now for a pt-archiver request on a cluster.
freno brought a unified, auditable and controllable method for throttling our app writes. There is now a single, highly available, entity querying our MySQL servers.
Querying freno is as simple as running:
$ curl -s -I http://my.freno.com:9777/check/myscript/mysql/clusterB
where the myscript app requests access to the clusterB cluster. This makes it easy to use by any client.
Open source
freno has been open source since early in its development and is available under the MIT license.
While the simplest client may just run a HTTP GET request, we’ve also made available more elaborate clients:
- freno-client is our Ruby client for
freno, which we use at GitHub. - A Perl module to be used as plugin for
pt-archiver, see also this doc page. - gh-ost is
frenoaware. Pass--throttle-http=<location of freno>, see doc page.
freno was built for monitoring MySQL replication, but may be extended to collect and serve other metrics.
And then things took a turn
We wanted freno to serve those massive write operation jobs, typically initiated by background processes. However, we realized we could also use it to reduce read load from our masters.
Master reads
Reads from the master should generally be avoided, as they don’t scale well. There is only one master and it can only serve so many reads. Reads from the master are typically due to the consistent-read problem: a change has been made, and needs to be immediately visible in the next read. If the read goes to a replica, it may hit the replica too soon, before the change was replayed there.
There are various ways to solve the consistent-read problem, that include blocking on writes or blocking on reads. At GitHub, we have a peculiar common flow that can take advantage of freno.
Before freno, web and API GET requests were routed to the replicas only if the last write happened more than five seconds ago. This pseudo-arbitrary number had some sense: If the write was five seconds ago or more, we can safely read from the replica, because if the replica is lagging above five seconds, it means that there are worse problems to handle than a read inconsistency, like database availability being at risk.
When we introduced freno, we started using the information it knows about replication lag across the cluster to address this. Now, upon a GET request after a write, the app asks freno for the maximum replication lag across the cluster, and if the reported value is below the elapsed time since the last write (up to some granularity), the read is known to be safe and can be routed to a replica.
By applying that strategy, we managed to route to the replicas ~30% of the requests that before were routed to the master. As a consequence, the number of selects and threads connected on the master was reduced considerably, leaving the master with more free capacity:

We applied similar strategies to other parts of the system: Another example is search indexing jobs.
We index in Elasticsearch when a certain domain object changes. A change is a write operation, and as indexing happens asynchronously, we sometimes need to re-hydrate data from the database.
The time it takes to process a given job since the last write is in the order of a hundred milliseconds. As replication lag is usually above that value, we were also reading from the master within indexing jobs to have a consistent view of the data that was written. This job was responsible for another 11% of the reads happening on the master.
To reduce reads on the master from indexing jobs, we used the replication delay reported by freno to delay the execution of each indexing job until the data has been replicated. To do it, we store in the job payload the timestamp at which the write operation that triggered the job occurred, and based on the replication delay reported by freno, we wait until we are sure the data was replicated. This happens in less than 600ms 95% of the time.
The above two scenarios account for ~800 rps to freno, but replication delay cannot grow faster than the clock, and we used this fact to optimize access and let freno scale to growing usage demands. We implemented client side caching over memcache, using the same replication delay values for 20ms, and adding a cushioning time to compensate both freno sampling rates and the caching TTL. This way, we capped to 50rps to freno from the main application.
Scaling freno
Seeing that freno now serves production traffic, not just backend processes, we are looking into its serving capacity. At this time a single freno process is well capable of serving what requests we’re sending its way, with much room to spare. If we need to scale it, we can bootstrap and run multiple freno clusters: either used by different apps and over different clusters (aka sharding), or just for sharing read load, much like we add replicas to share query read load. The replicas themselves can tolerate many freno clients, if needed. Recall that we went from dozens/hundreds of throttler connections to a single freno connection; there’s room to grow.
Motivated by the client-side caching applied in the web application, we now can tell freno to write results to memcached, which can be used to decouple freno’s probing load from the app’s requests load.
Looking into the future
freno & freno-client make it easy for apps to add throttling to massive operations. However, the engineer still needs to be aware that their operation should use throttling, and it takes a programmatic change to the code to call upon throttling. We’re looking into intelligently identifying queries: the engineer would run “normal” query code, and an adapter or proxy would identify whether the query requires throttling, and how so.
Authors


Written by

Related posts
Better tools made Copilot code review worse. Here’s how we actually improved it.
How migrating Copilot code review to shared Unix-style code exploration tools reduced review cost by reshaping agent workflows around pull request evidence.
Automating cross-repo documentation with GitHub Agentic Workflows
Explore how the Aspire team turns merged product changes into SME-reviewed docs pull requests, closing the gap between release and documentation.

From latency to instant: Modernizing GitHub Issues navigation performance
How the GitHub Issues team used client-side caching, smart prefetching, and service workers to make navigation feel instant.