Keeping an eye on our network
Visibility is essential to effectively operating complex systems. As our network has grown, we’ve had to improve the the way we collect data about it to keep up. Key to…
Visibility is essential to effectively operating complex systems. As our network has grown, we’ve had to improve the the way we collect data about it to keep up. Key to these improvements has been the ability to tag metrics. Tagging has allowed us to build dashboards that start at a high level and facilitate drilling down into interesting or problematic areas by filtering and aggregating on multiple dimensions. A simple example below shows data flowing across a set of our spine switches during a rolling update:

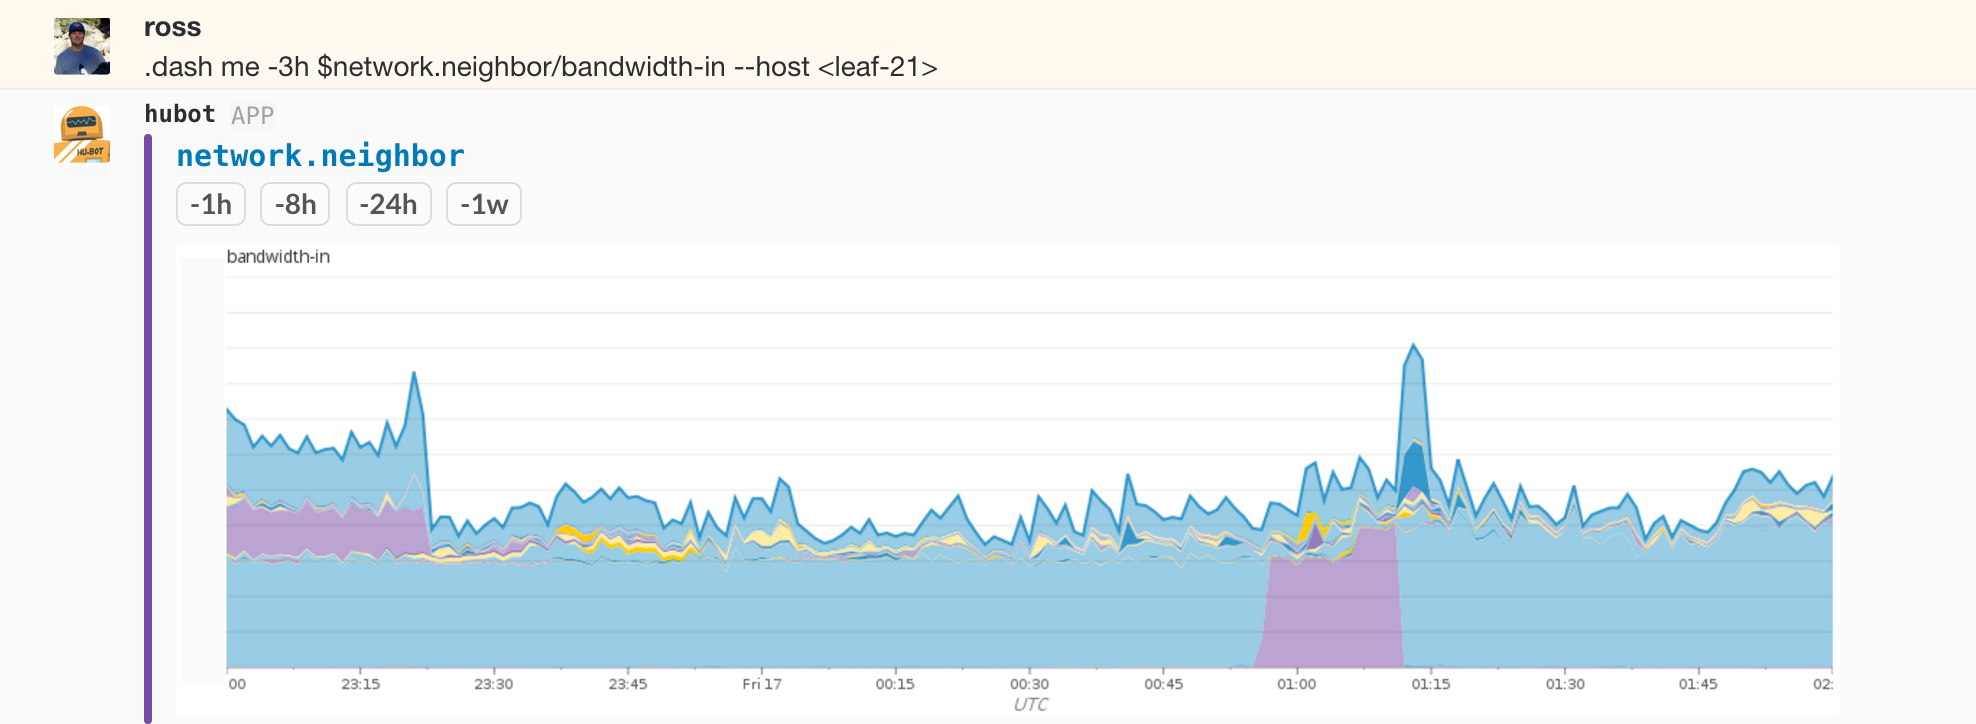
Starting just prior to midnight UTC the first switch was drained and returned to service around 30 minutes later. From there, the other three spines were updated in sequence. We kept a close eye on this and related graphs during the process to make sure that traffic volumes were not impacted and that things left and returned to the devices when expected. It’s tough to fully demonstrate the flexibility we have in a handful of static graphs, but for example, if we wanted to dig in deeper to see what neighboring devices were sending traffic to the first spine we drained, we could flip around and look by neighbor:

Again traffic drains from and returns to the device during the maintenance. The interesting bit here is that we can now see what neighbors decided to use spine 1 due to BPG best path selection when spine 3 was out of consideration. Picking one of the leaf switches that shifted during the period and flipping things yet again we can plot what neighbors it was sending traffic to, this time including individual hosts given that it’s a leaf. The cutover from spine 3 to spine 1 and back is visible:
We have this instrumentation on all of our network devices with tagging suited to the role. One of the more interesting areas is the border routers, the devices that connect our data centers to the outside world via transit and peering. Some of the things we have the ability to filter and aggregate by are site, device, interface, provider/peer. Below is a graph of transit bandwidth across all devices in a point of presence grouped by provider over a one week period, and the same graph for a one hour span during a recent DDoS event:
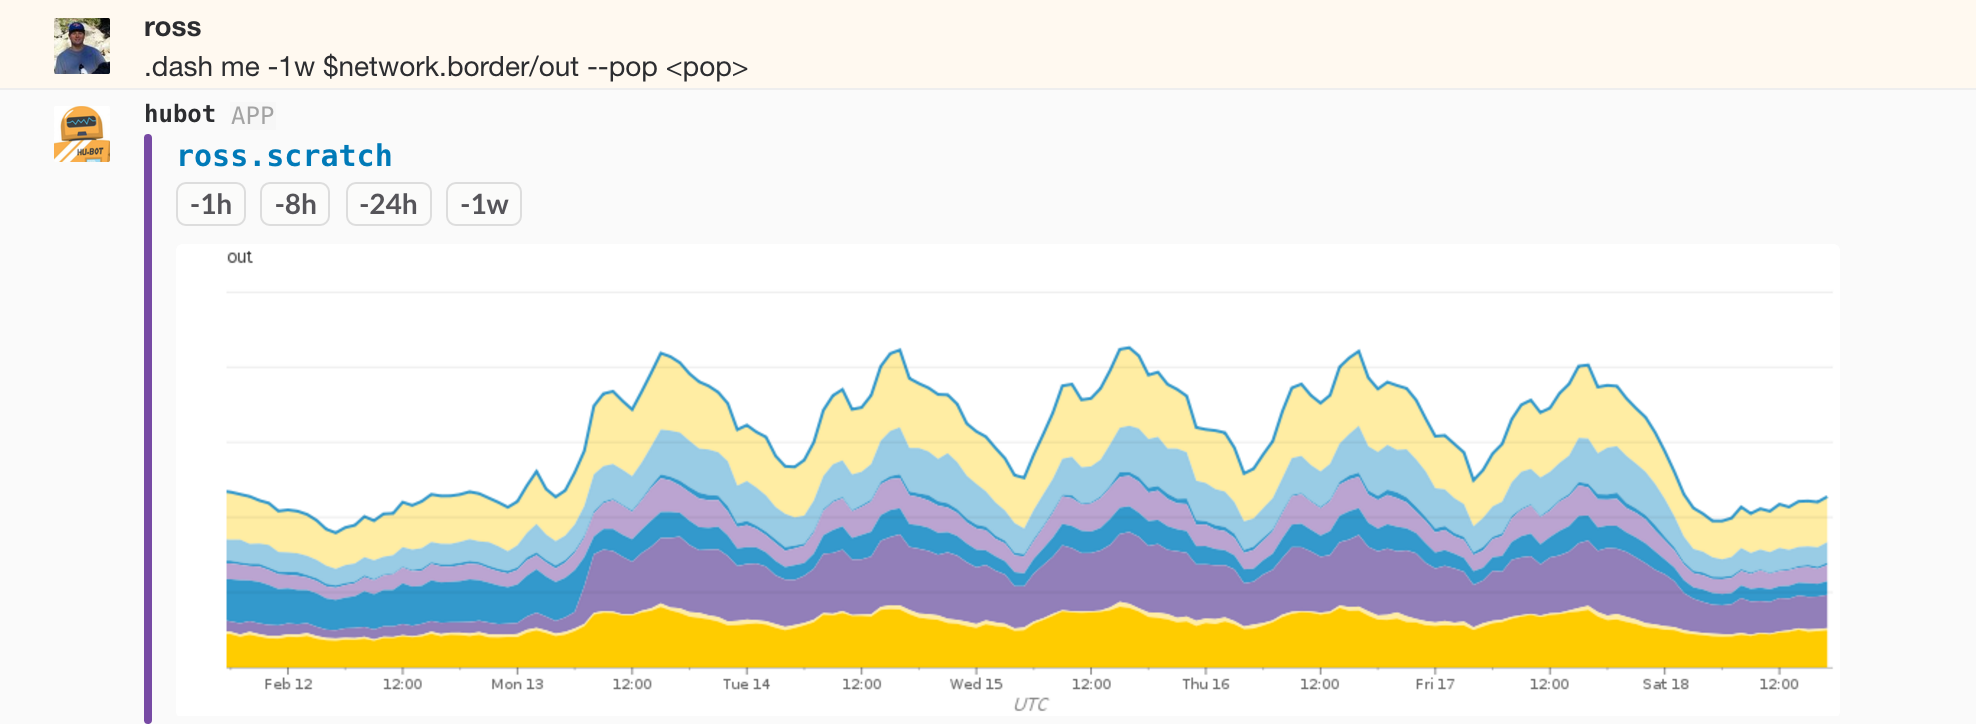
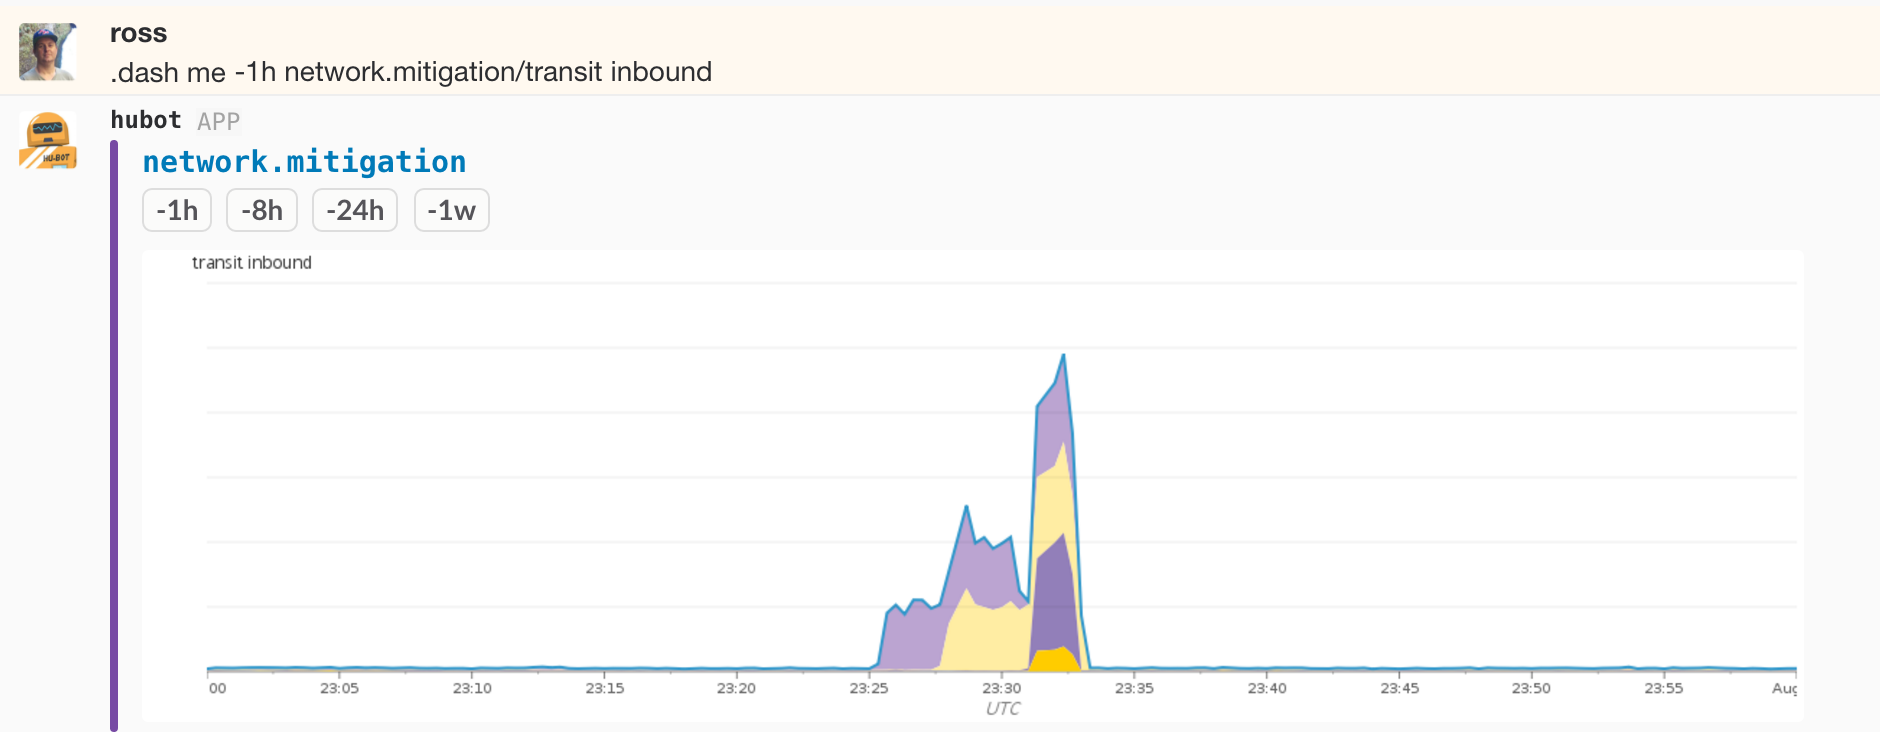
This information is critical to detecting and defending against attacks, and essential to keeping an eye on capacity utilization and determining our future needs. When combined with host-level stats, flow data, and external route monitoring, it equips us with the data we need to effectively operate GitHub.
Where the data comes from
Network devices expose data about health and performance over Simple Network Management Protocol (SNMP.) While the protocol itself is in theory simple, understanding the schemas that lay out where to find the desired data is not. It takes spending some time with them before they start to make sense.
For our purposes there were two types of information: stats on the network interfaces and data about the performance and health of the devices themselves. Things like temperature, load, and memory usage are collected from device specific scalar values and stored for graphing and monitoring. Common interface stats are available via IF-MIB::ifTable, IF-MIB::ifXTable, and in some cases additional vendor specific tables. Each row includes an index that allows grouping values for an interface. For example a subset of the fields available for index 528 on one of our border devices:
...
IF-MIB::ifDescr.528 = STRING: xe-0/0/5
...
IF-MIB::ifHCInOctets.528 = Counter64: 987957376
...
IF-MIB::ifHCOutOctets.528 = Counter64: 40255192735
...
IF-MIB::ifAlias.528 = STRING: Transit: A Provider - ID:42434419
...
In the snippet above we can see that 987,957,376 octets have been received and 40,255,192,735 transmitted over a link to “A Provider” since the last time the counters rolled over. We currently collect around 20 symbols from these tables for all of our interfaces including in and out octets, drops, errors, and laser levels. We also collect interface speeds so that we can monitor and alert on interface utilization and spot problems before they have impact.
The neighbor functionality powering some of the graphs in the first section is build using data from the Link Layer Discovery Protocol available in LLDP-MIB::lldpRemTable. With some devices that’s as simple as grabbing the value from a corresponding index e.g. 528, but other devices require some intermediate mapping.
How we collect it
There are a pair of nodes in each region charged with collecting data from the network gear there. They run an agent that cycles every 10s. During each run the host checks to see if it’s the leader and if so, polls its pool of devices and submits the results. If not it goes back to sleep and tries again next time. This allows us to continue to get data in the event that one of the hosts fails. Thus far we’ve found two to be sufficiently robust, but the design allows for any number of hosts if we learn otherwise.
What’s next
We’ve been working with the basics of this system for around nine months and evolving and extending it as we go. The LLDP neighbor functionality for instance is only a couple months old. Unfortunately, the nature and current state of our solution doesn’t lend itself to open sourcing. It has dependencies on and assumptions about the specifics of environment and hardware.
If network monitoring and telemetric excites you, we’re looking to add more SREs to the team.
Written by

Related posts

GitHub availability report: June 2026
In June, we experienced six incidents that resulted in degraded performance across GitHub services.

Q1 2026 Innovation Graph update: Open source collaboration is accelerating worldwide
New Innovation Graph data shows global developer communities growing faster than ever, with collaboration reaching new highs across many economies.
GitHub joins coalition advocating for fixes to California AI Transparency Act to protect open source
We’re calling for targeted amendments to resolve conflicts with open source licensing and align with international transparency frameworks while preserving regulatory intent.