Exception Monitoring and Response
Like most software applications, GitHub can generate a few exceptions. Incoming exceptions range from system-level issues including Git timeouts and missing references, to application-level issues including simple code mistakes and…
Like most software applications, GitHub can generate a few exceptions. Incoming exceptions range from system-level issues including Git timeouts and missing references, to application-level issues including simple code mistakes and JavaScript errors.
We take stability and performance seriously, so we need a way to quickly identify issues as they surface, determine the best teams or individuals to ping, and ship any relevant changes as soon as possible. Haystack helps us do that.
Haystack, our internal exception tracking application, is a product of 6 years of development. We use it to monitor practically every user-facing property we build, including our desktop applications.
A typical scenario begins with deploying a change.
Once an engineer deploys via chatops, Hubot will ping them with a link to a firehose, which is a view that will show only exceptions that happen after their changes are live, reminding them to keep an eye on exceptions. Meanwhile, Haystack has been continuously monitoring the health of all applications—looking for exception rates that differ from recent typical rates. While we hope engineers will keep an eye on the firehose, asking someone to “keep an eye on Haystack” is like asking them to watch grass grow via Livestream. That’s why we need a bit of anomaly detection.
We have a couple simple rules for anomaly detection that serve most of our needs for frontline defense against bad deploys or typical errant behavior. We ensure the number of incoming exceptions meets a minimum threshold, since even on our best days we are generating some noise. We then fetch a histogram of the last hour of exception counts to determine if the last point is beyond a configured z-score. This doesn’t work well in cases where exceptions have been elevated for a large chunk of the hour, but at that point, we’ve likely elevated the severity of the issue and multiple people are investigating. We want to augment a developer’s ability to responsibly monitor their changes, not offload it completely to machines.
exception_counts = app.needles.histogram(1.hour.ago, Time.now, 3.minutes)
stddev = exception_counts.standard_deviation
mean = exception_counts.mean

if zscore(exception_counts.last, mean, stddev) > app_zscore
  campfire.message(message) if last_deploy.warned_at.nil?
end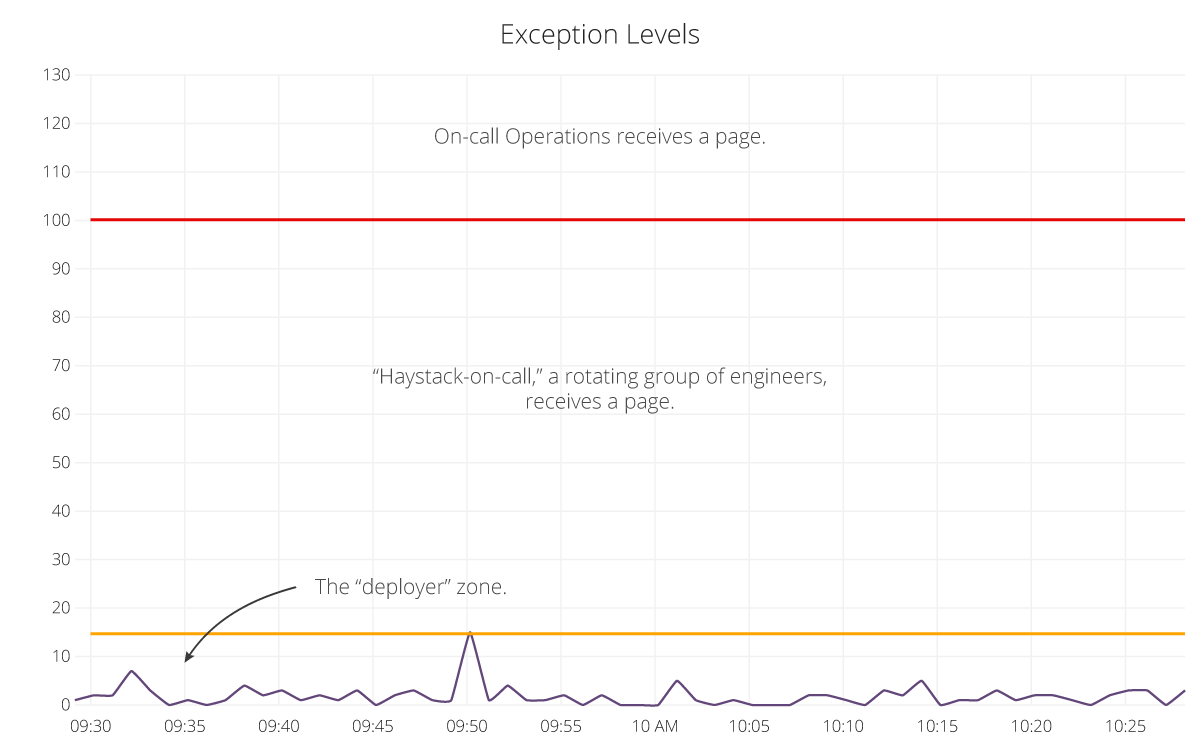
If an exception elevation is detected, Hubot will ping the last deployer with some general statistics about the application’s current state. The immediate benefit of this ping is that it implicitly sets a responsible party. In a perfect world, only the person who might have caused the spike in exceptions should receive the ping. We’re not in a perfect world just yet, but we’re iterating on it.
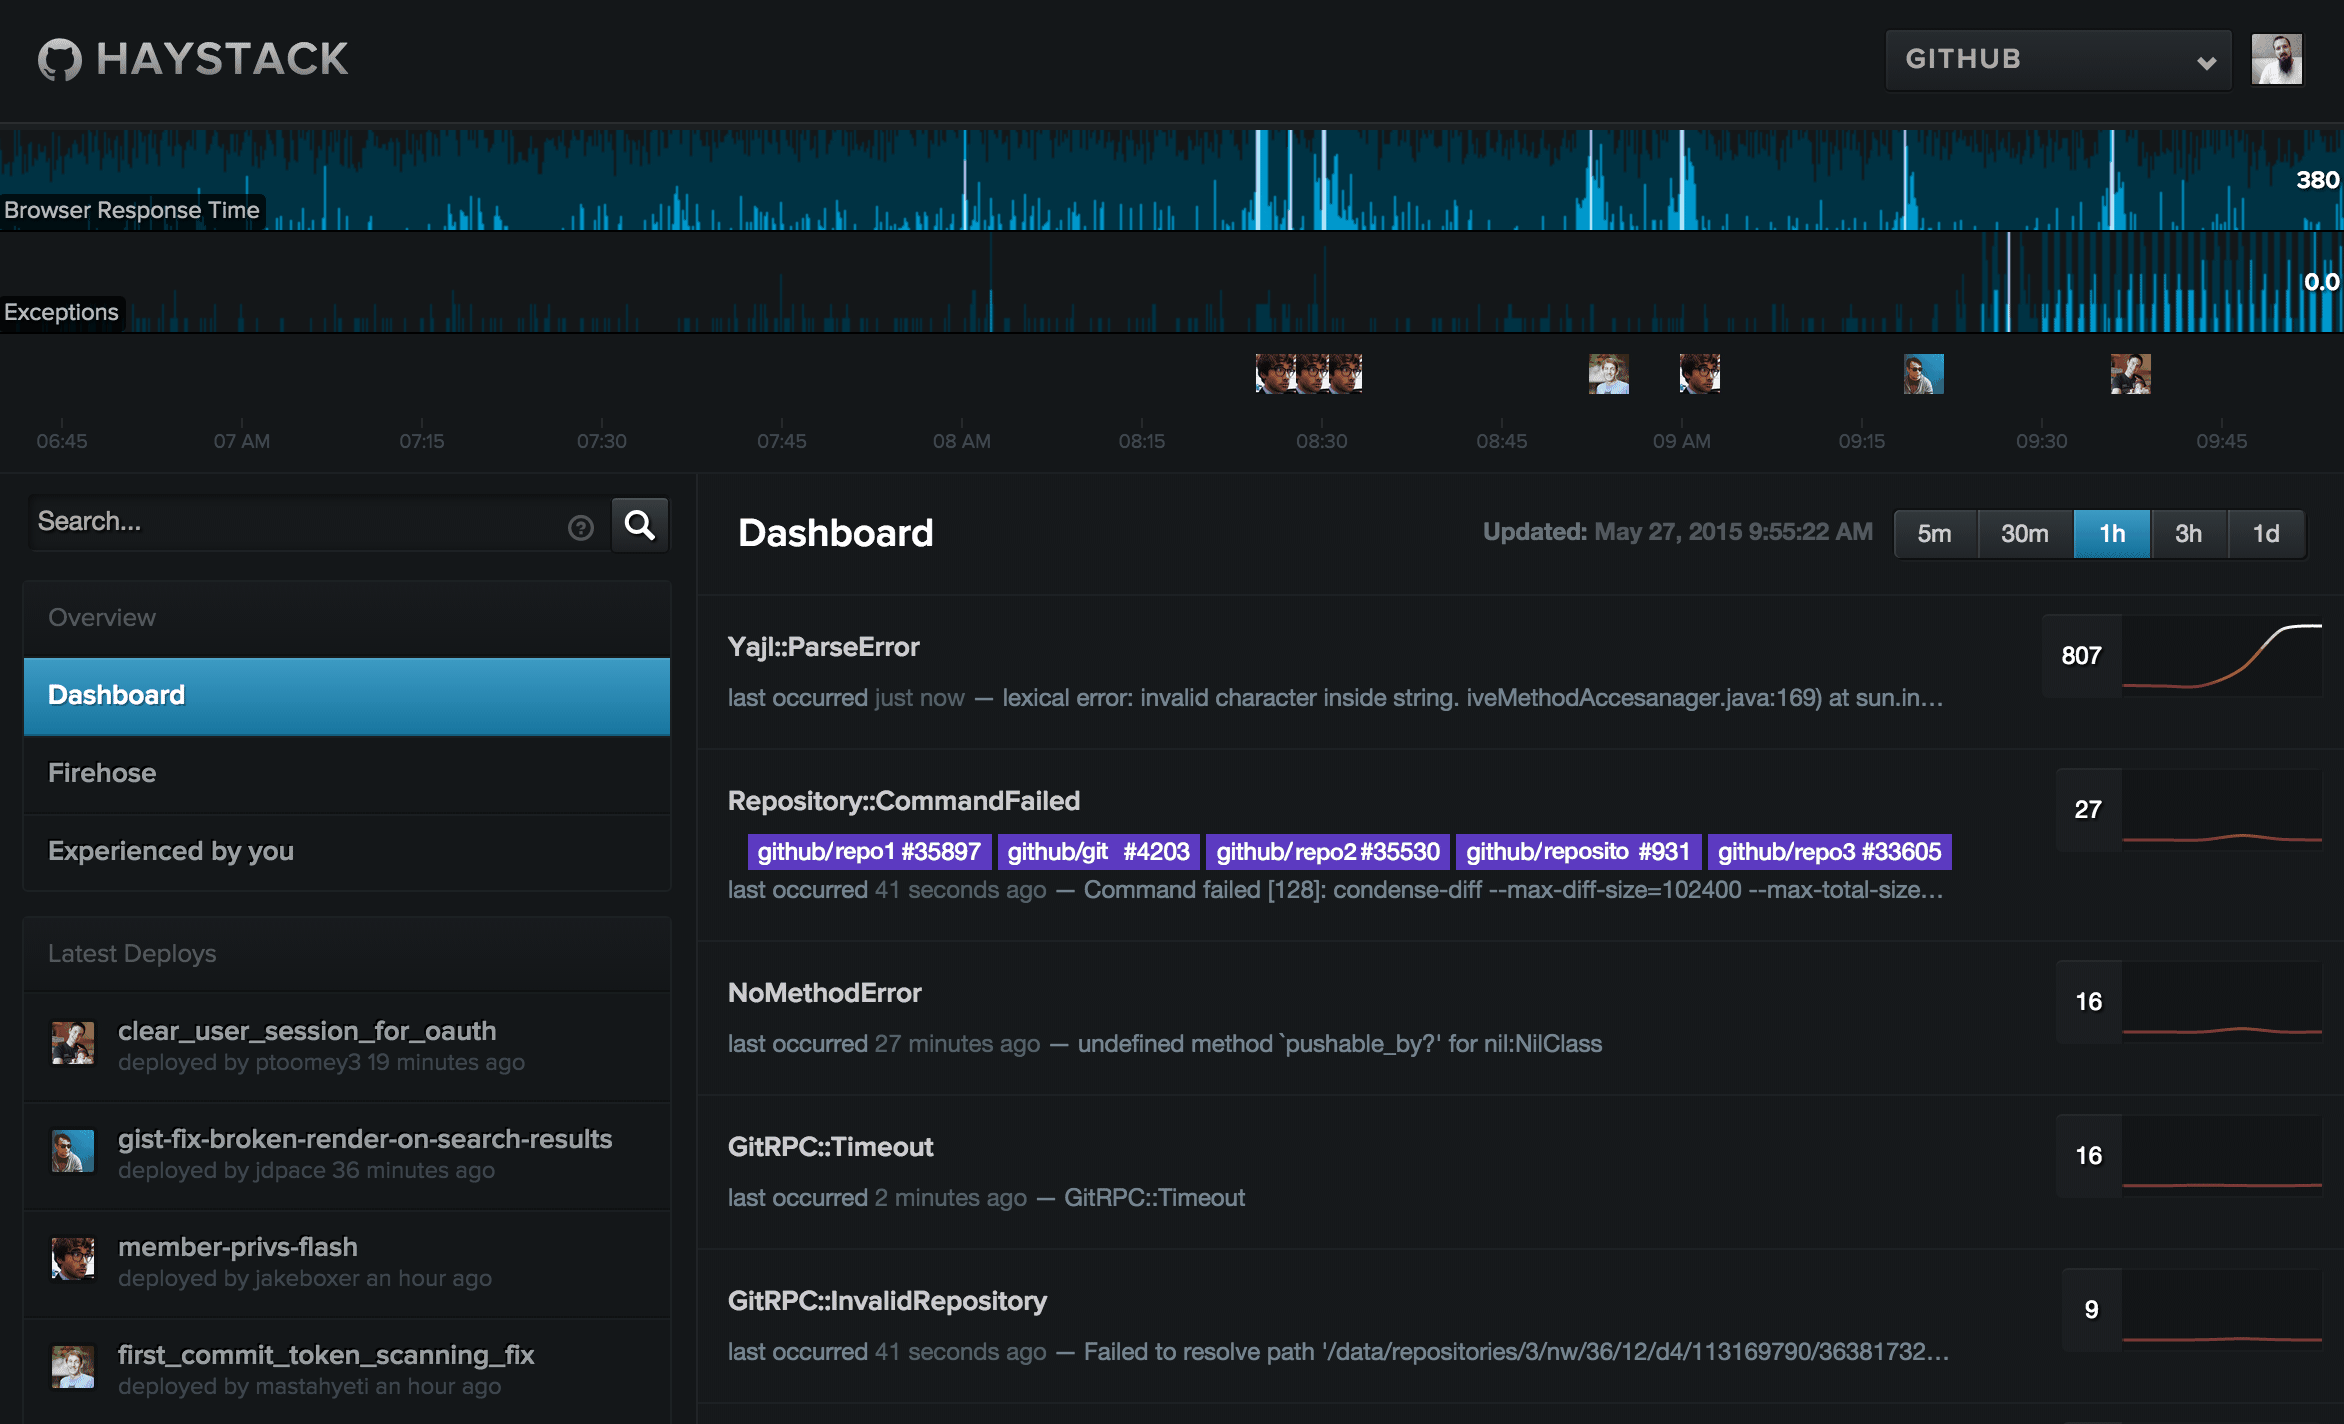
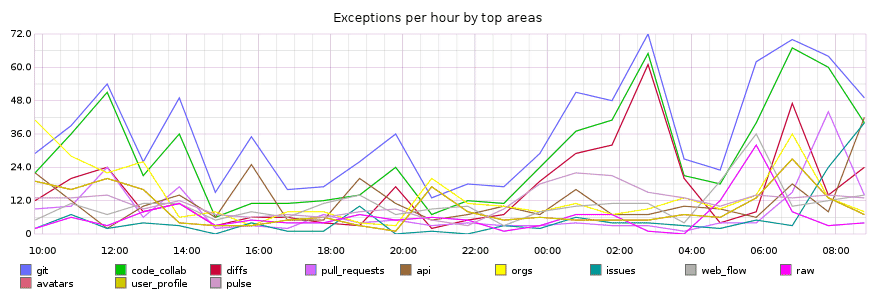
Let’s take a quick peek to see how things are looking.
Looks like there are a few Git-related issues cropping up, but we can get more detail by checking out the Haystack dashboard.
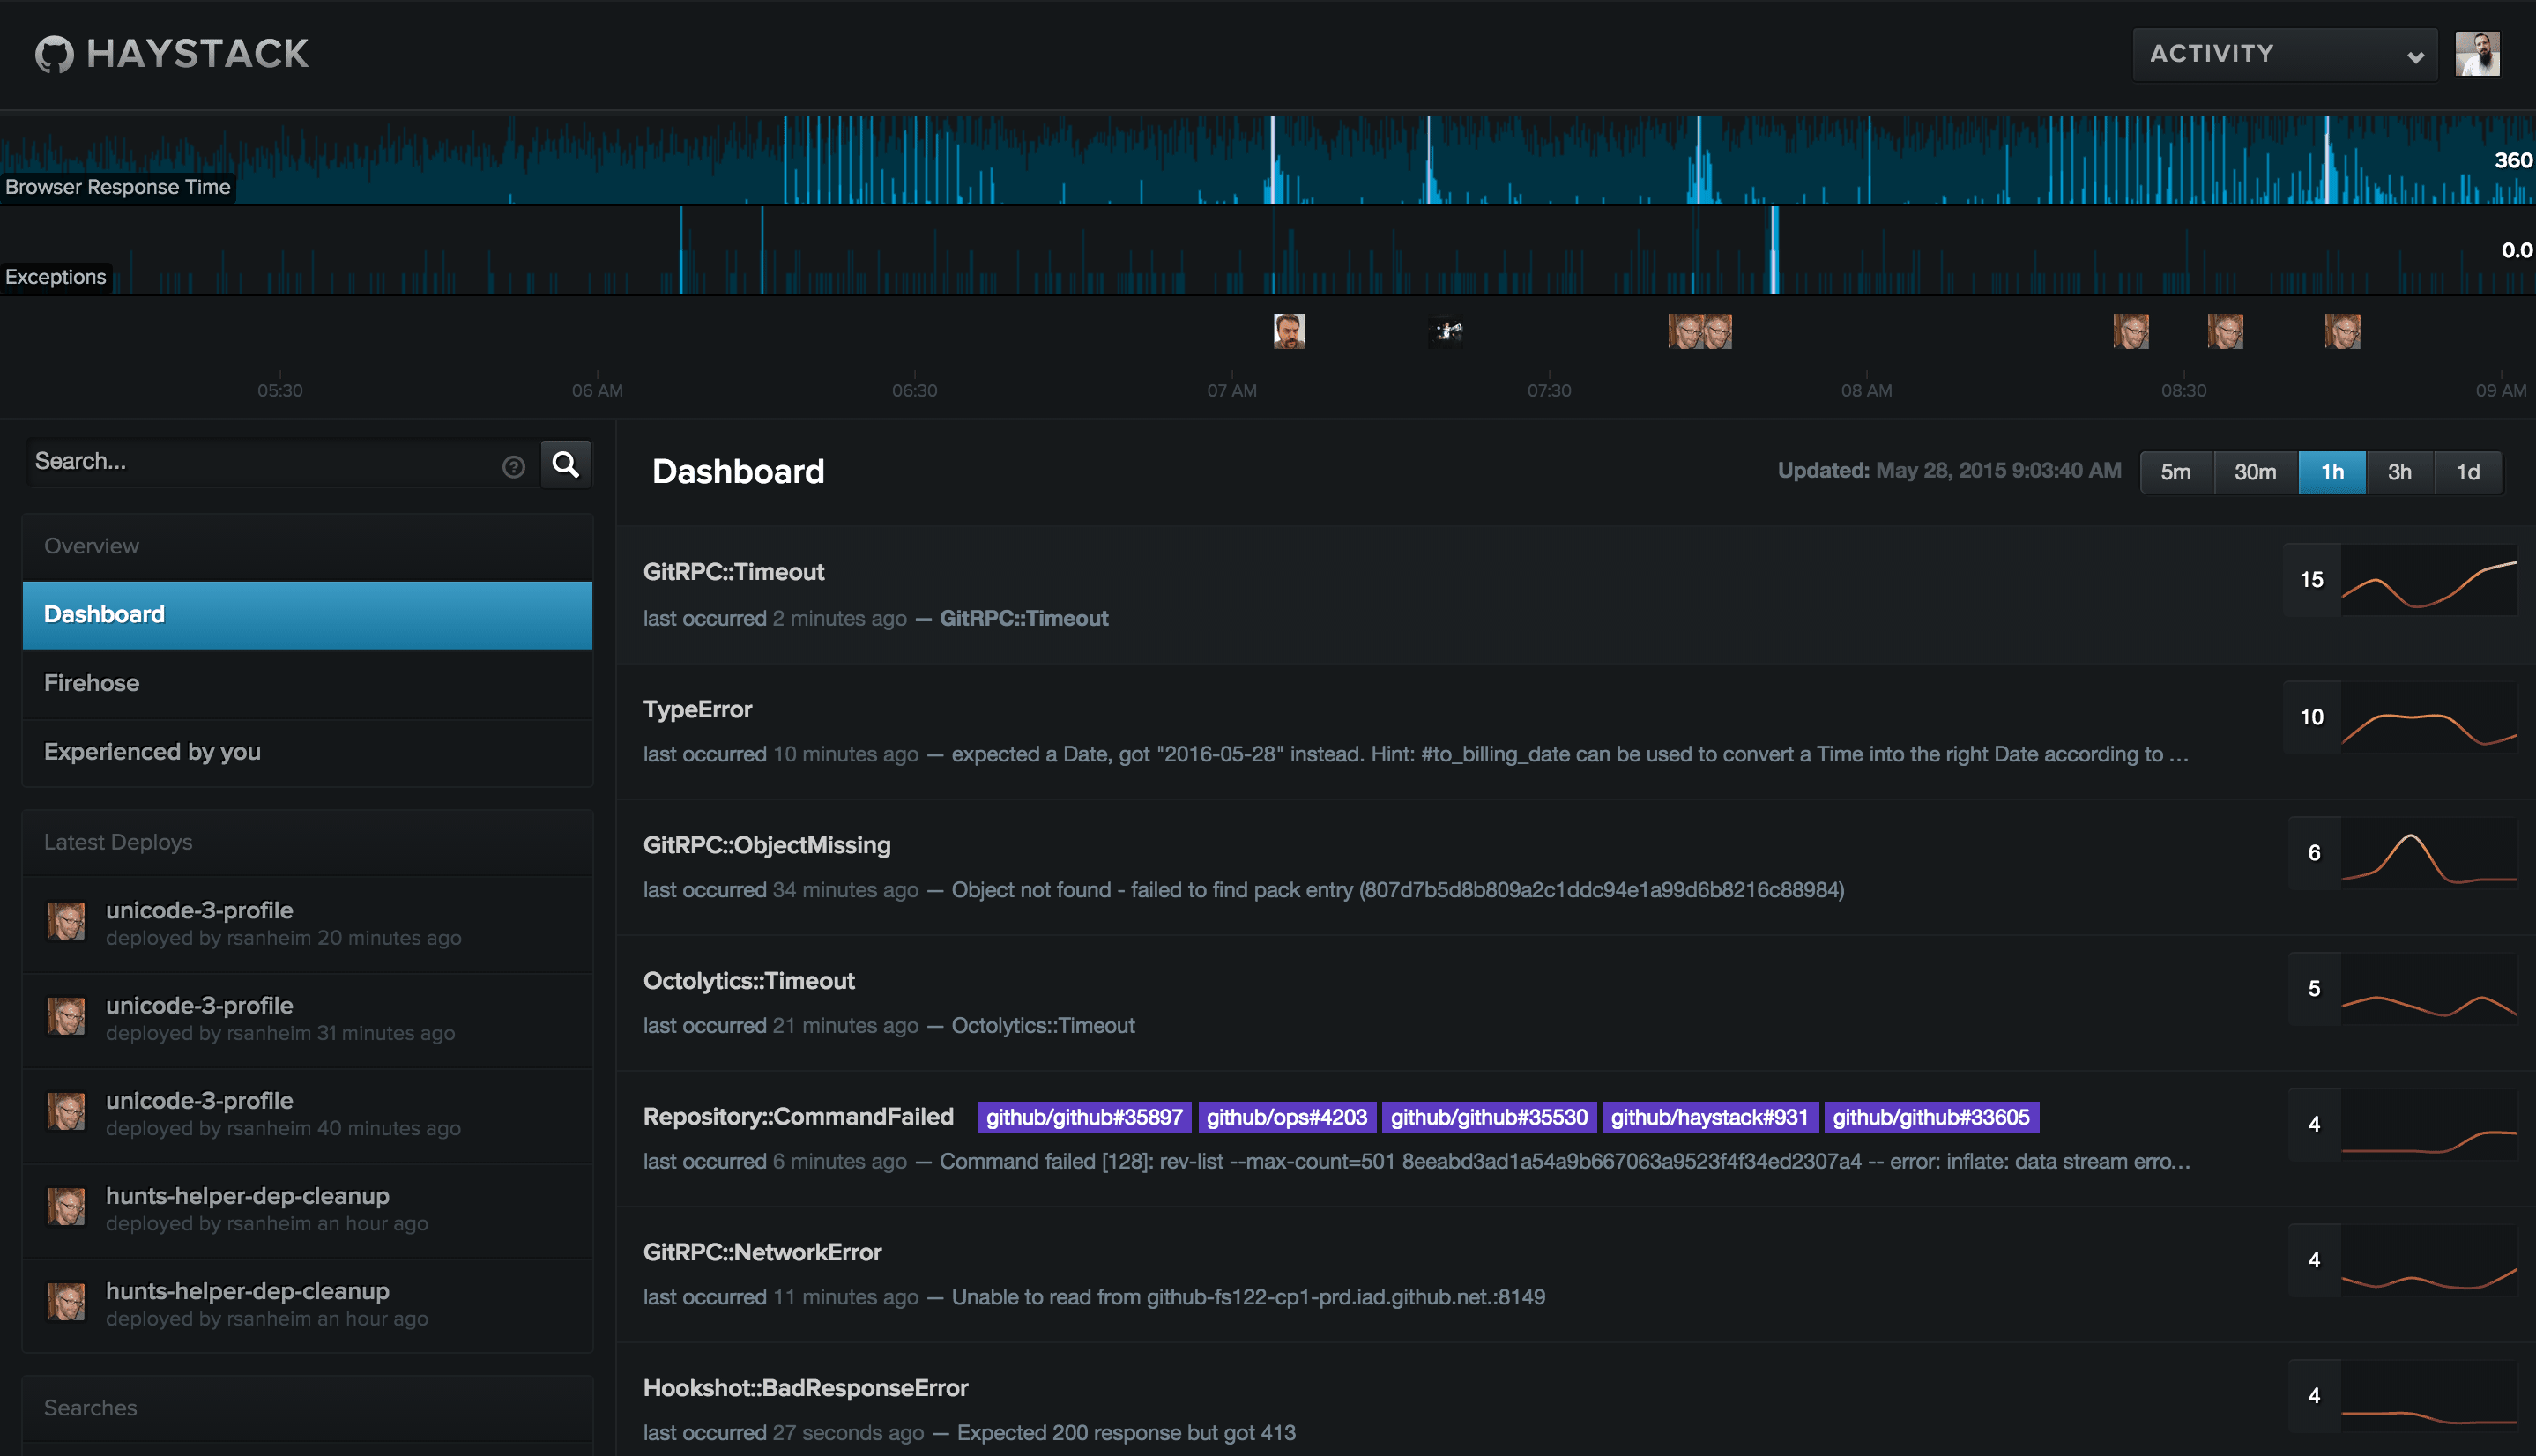
It looks like GitRPC is timing out. GitRPC::Timeout exceptions are raised when a Git operation on one of our fileservers takes too long to complete. As you can imagine, there are many places in our application where this could happen. We need to quickly identify what’s happening, where it’s happening, and who we should ping.
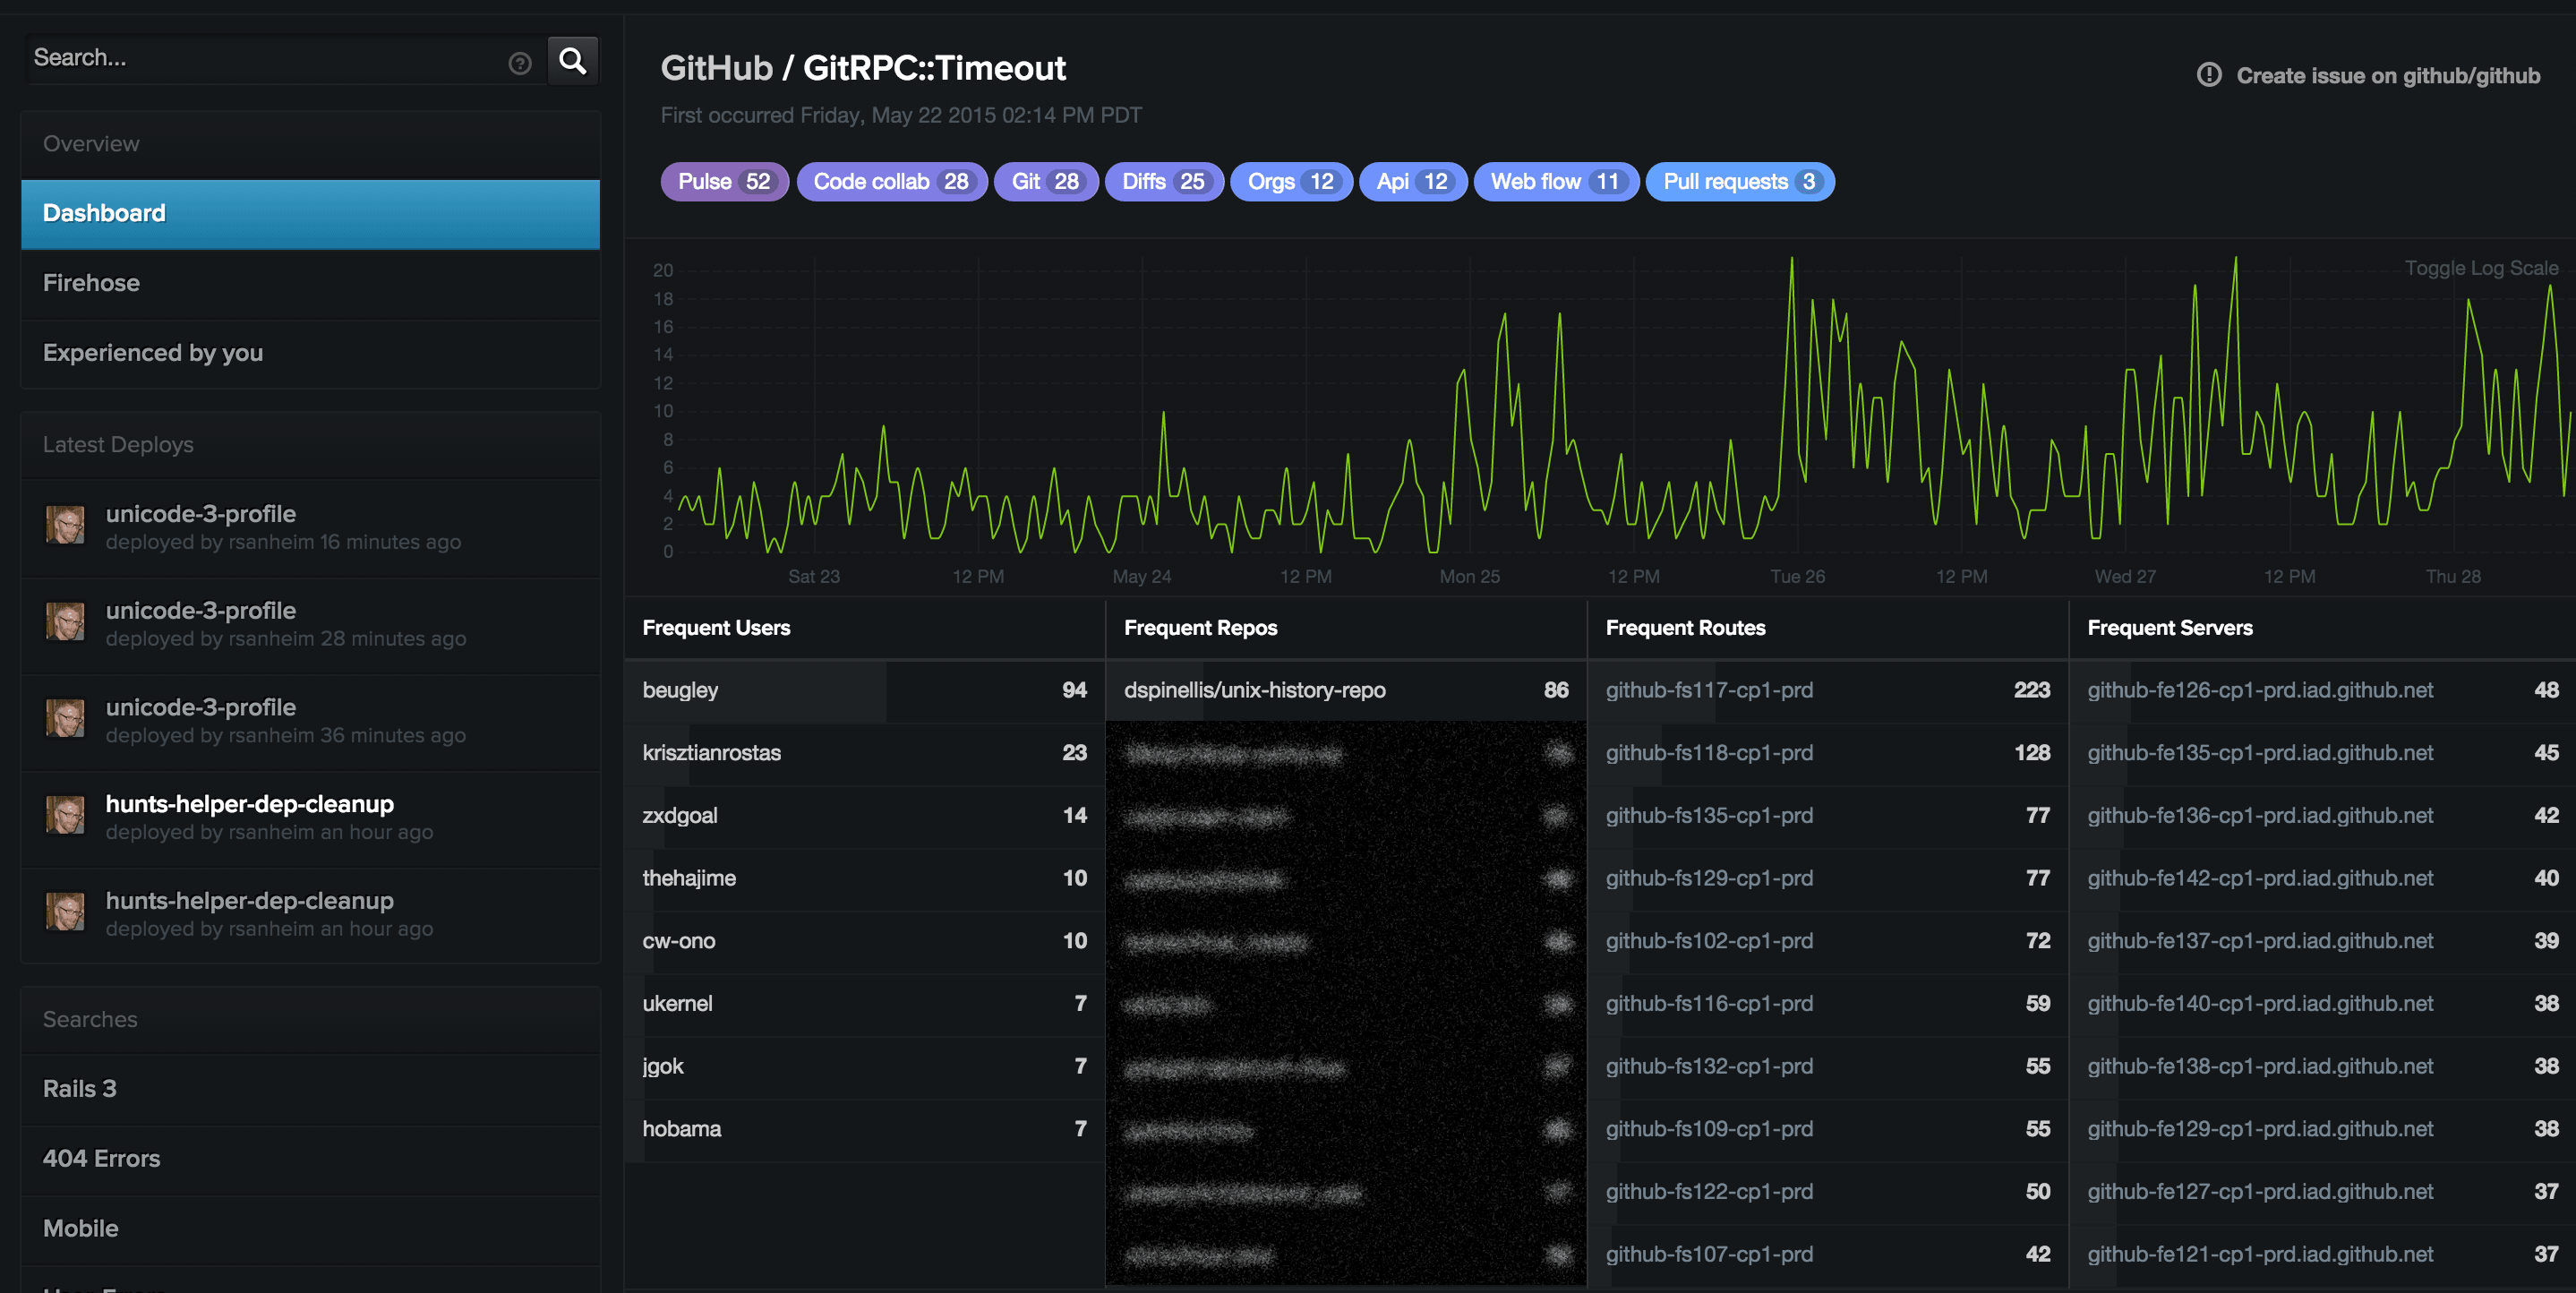
We can examine this by looking at the Rollup detail. Rollups represent a group of similar needles, usually determined by hashing some common properties between needles. By looking at the Rollup, I can immediately see how many exceptions have been coming in over time, the users experiencing it, the repositories it’s happening the most on, the routes and servers it’s being served from, and scrolling further down I can see the individual needles coming in. But, if you look at the top of this image, you can see these purple and blue items. These are what we refer to “Areas of Responsibility” or AORs.
Areas of Responsibility help us in a couple of ways. They define instantly recognizable high-level areas of the site, and within each of those, a set of teams generally responsible for their well being and upkeep. Beyond that, we track exception rates for AORs in Graphite, so we can see any degradation over time.
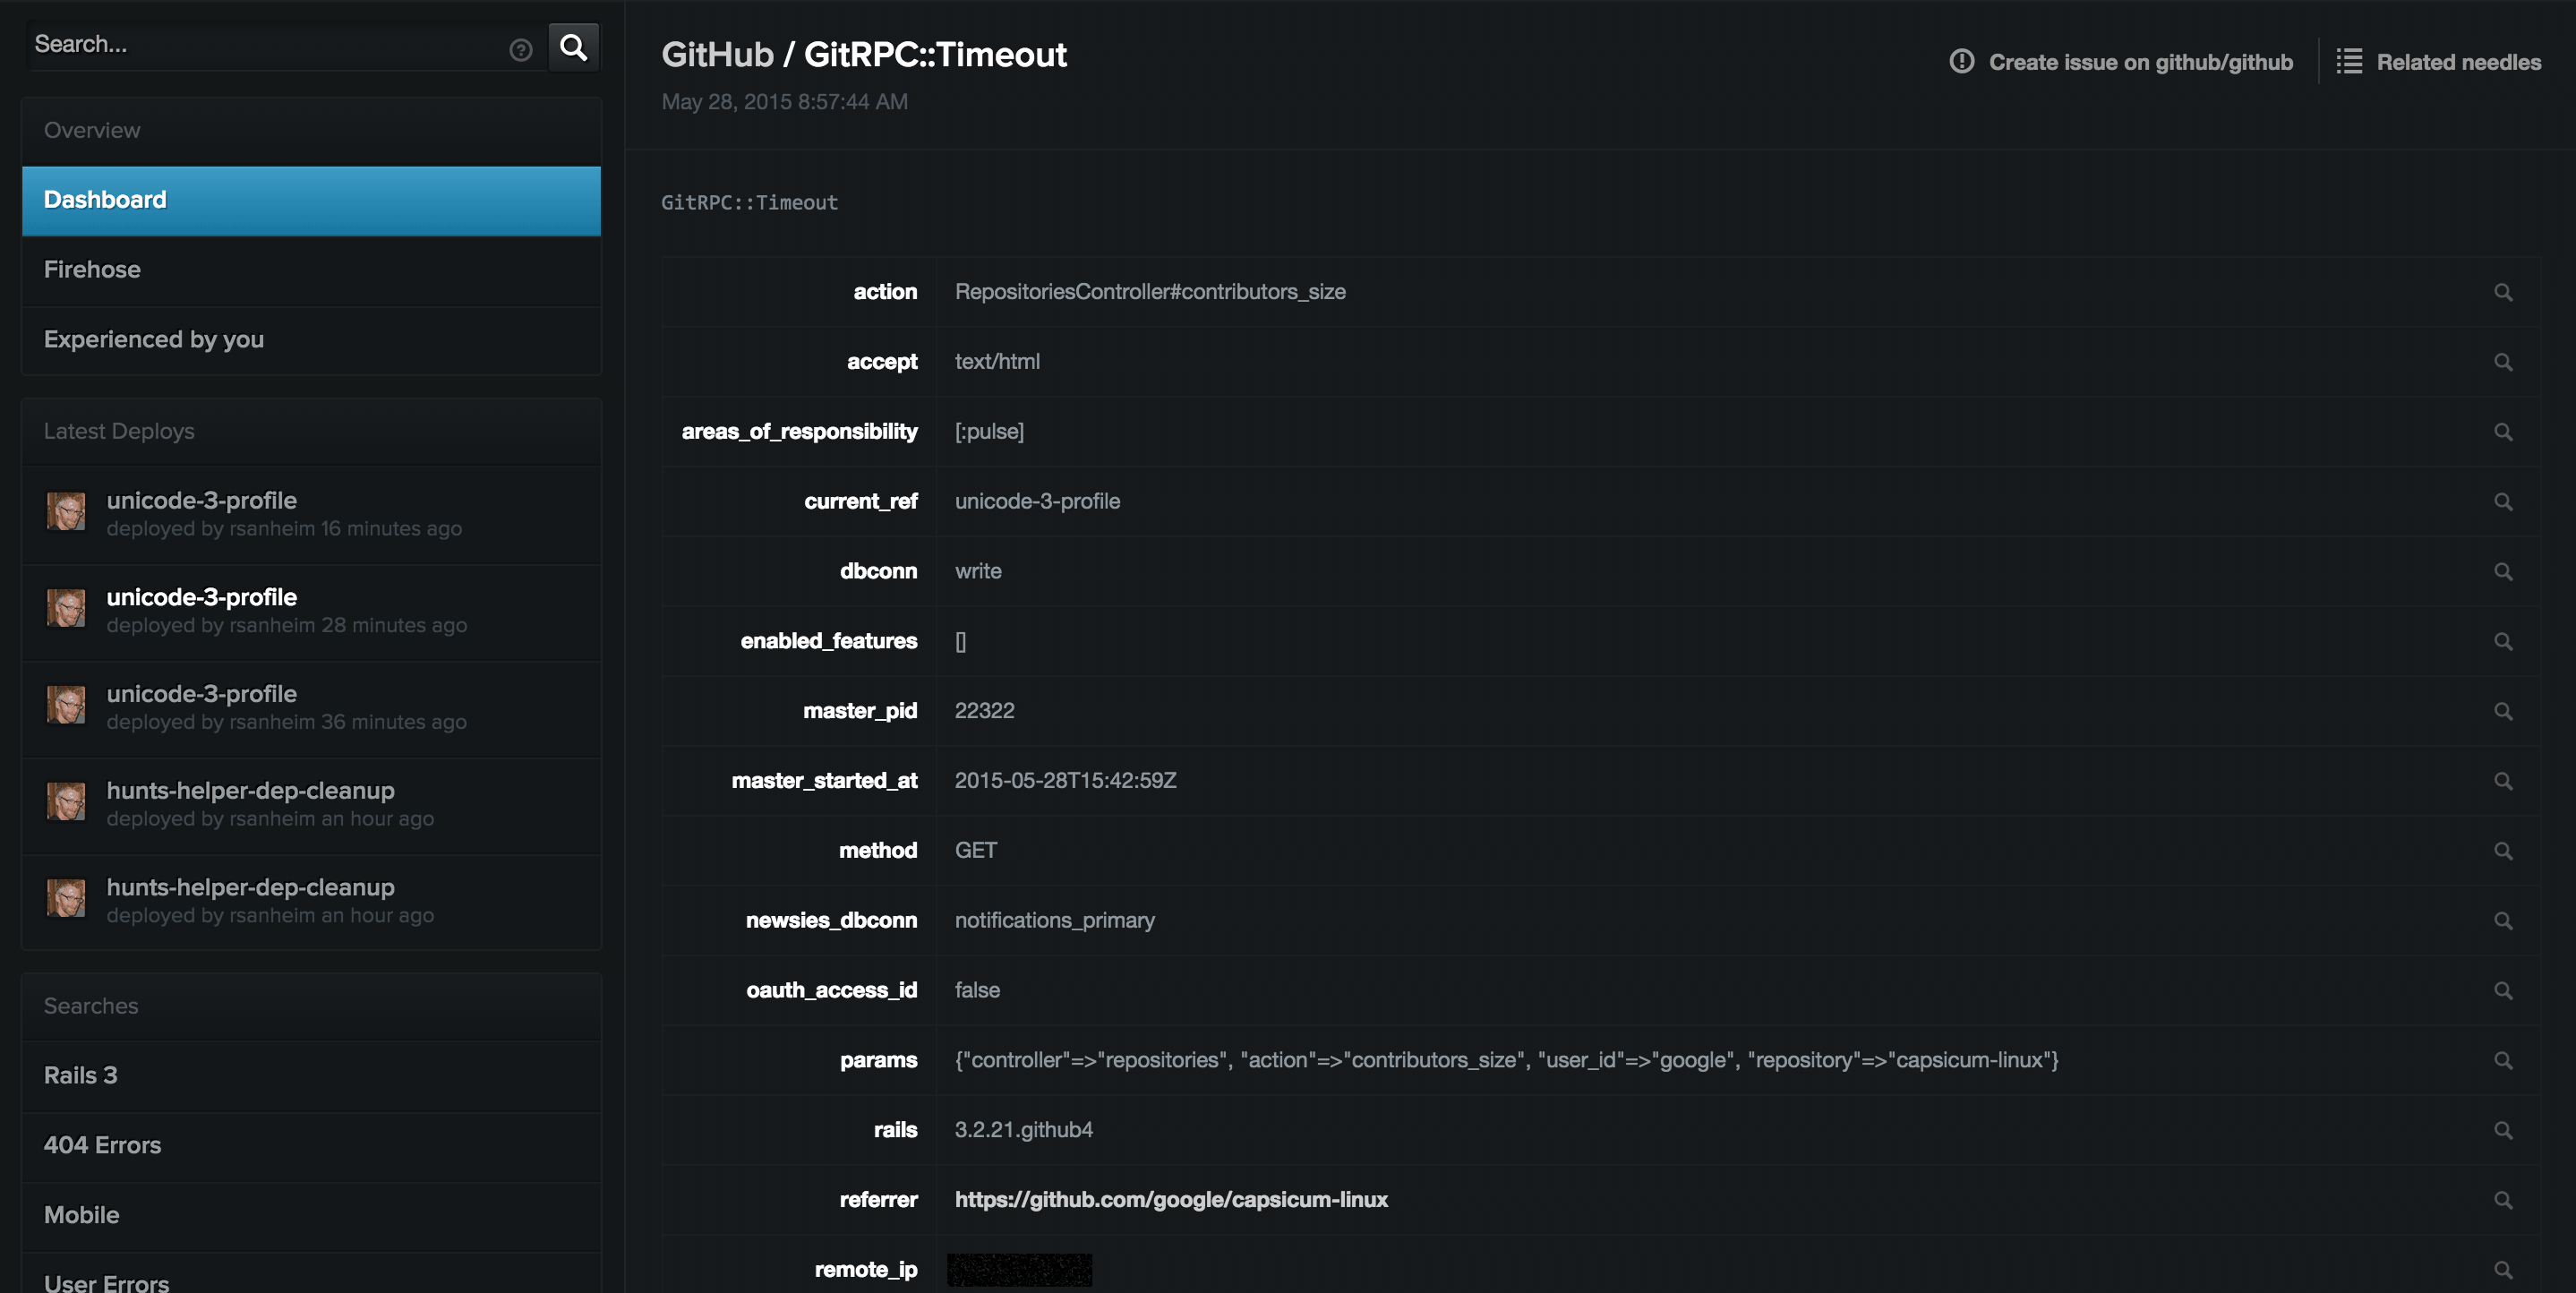
Given we established earlier that we use Git in a lot of places, there are a lot of AORs attached to this rollup. We can, however, see a bunch of identical needles coming in recently and if we click on one of them, we get more details. In particular, we can see that something is up with the :pulse area of the site. It happened in the action RepositoriesController#contributors_size while the unicode-3-profile branch was deployed. This is a small fraction of the information we can get about this exception.
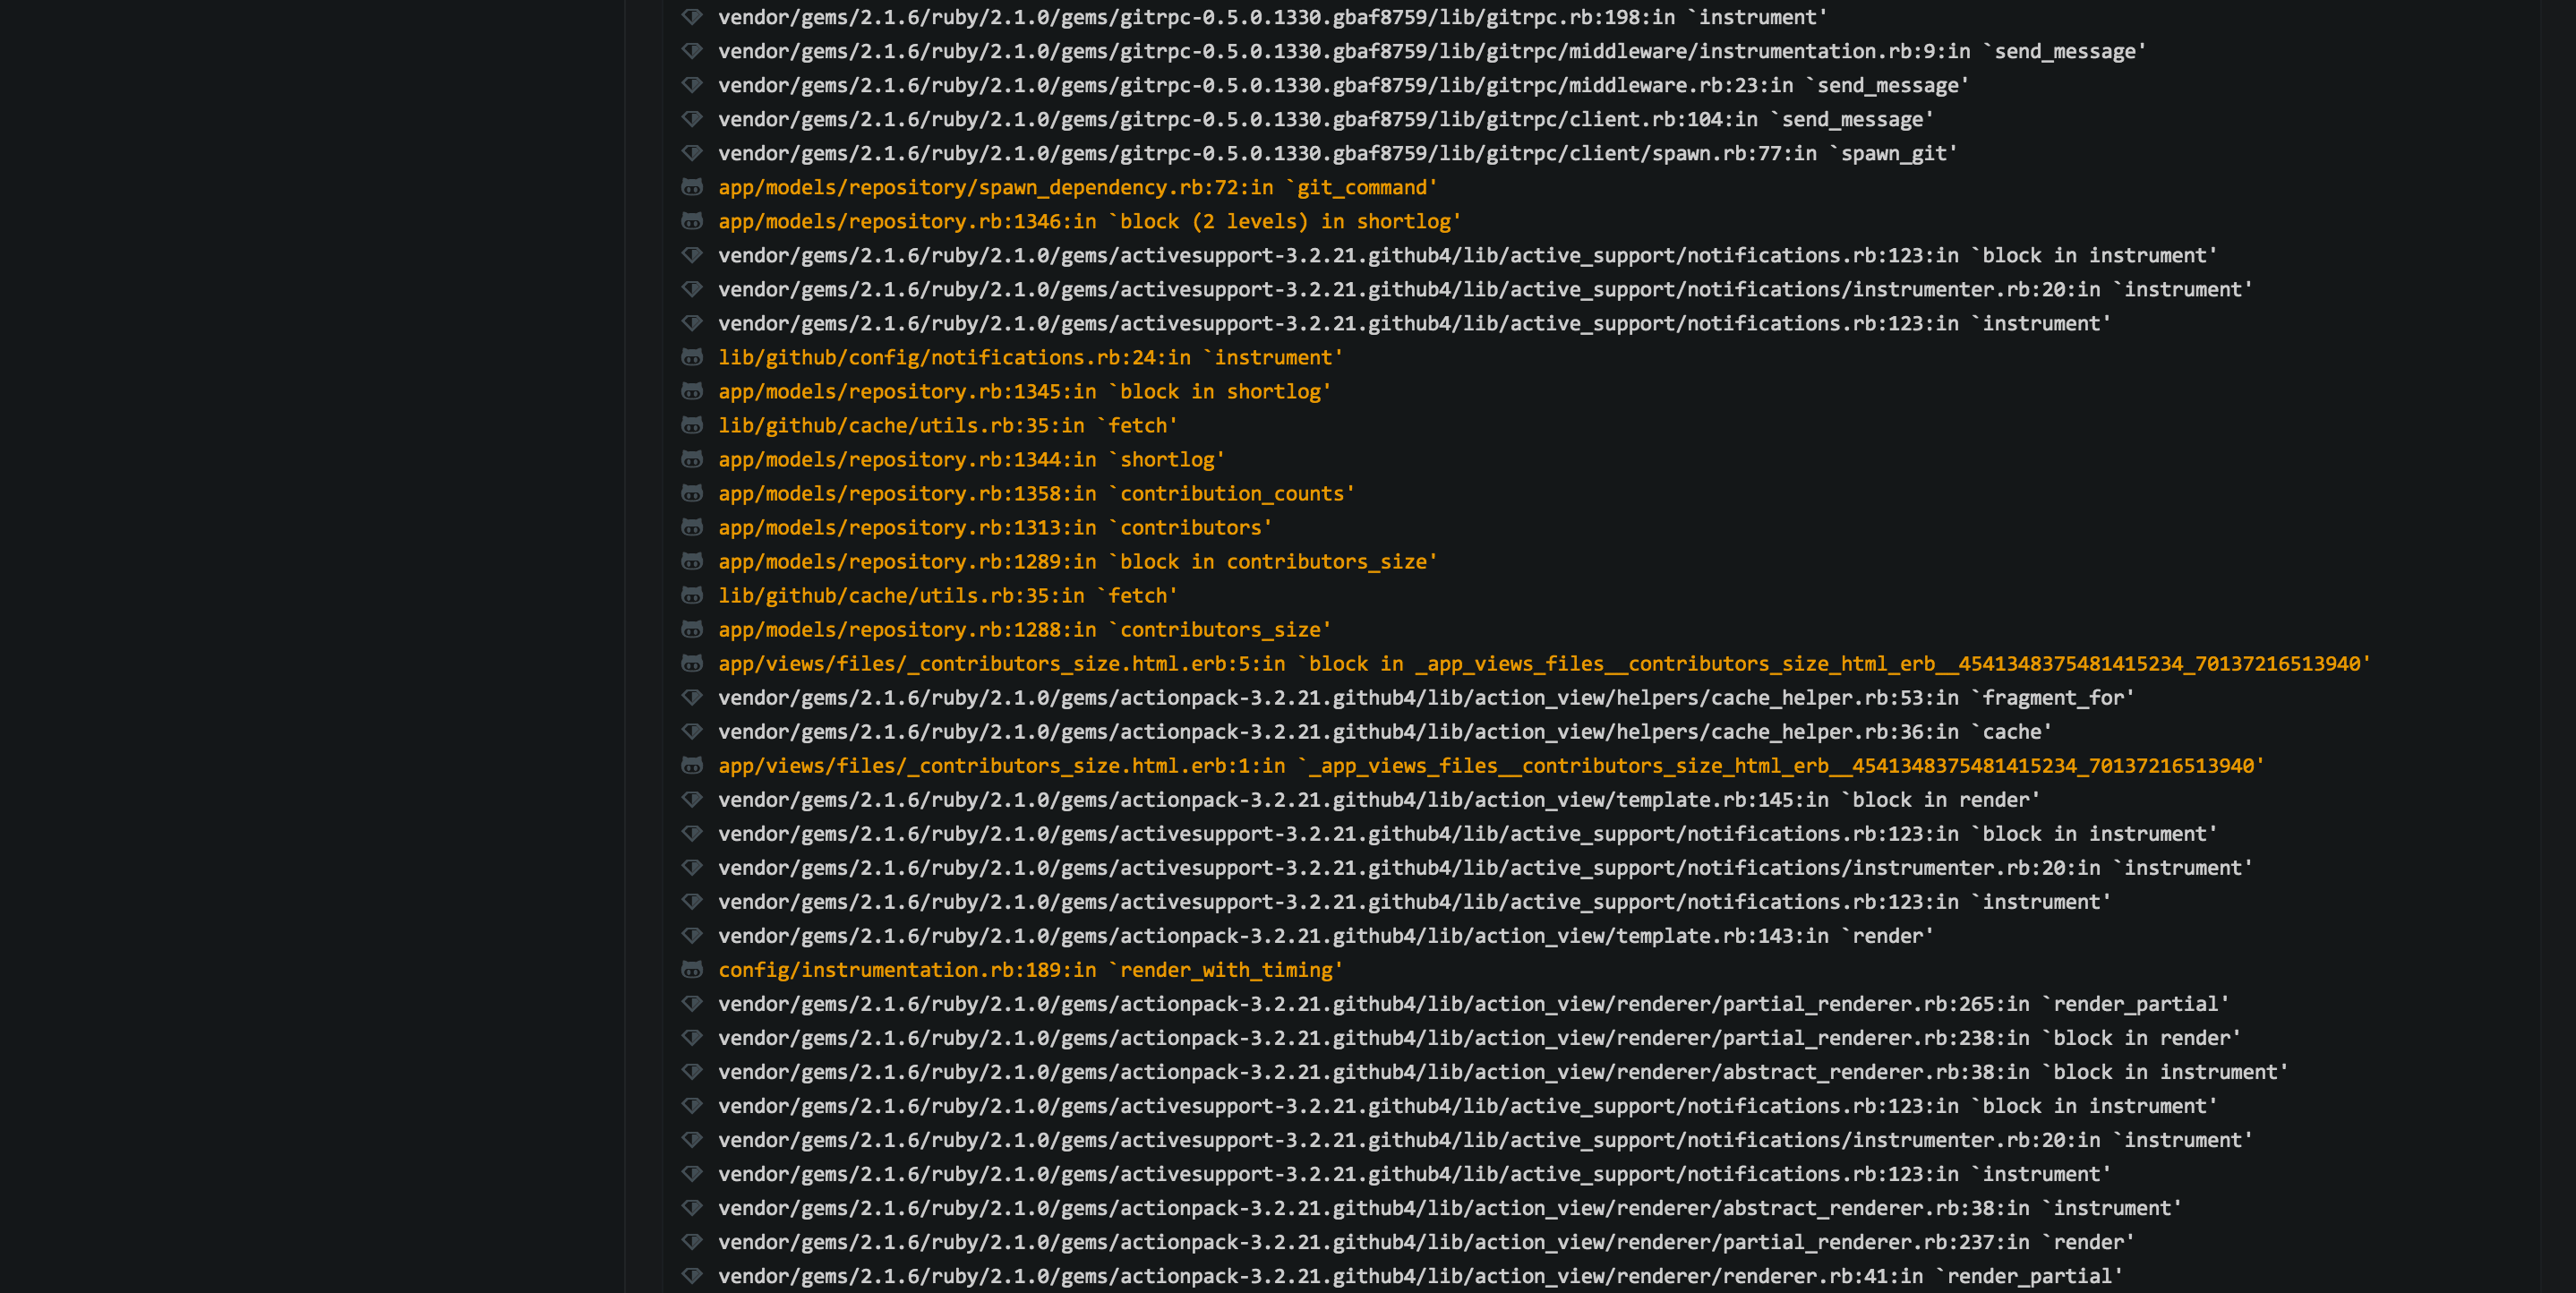
Another helpful bit of this exception page is the formatted backtrace where you can quickly see application code highlighted in orange. We also strip away any prefix paths and link lines in the backtrace to their respective source files on GitHub.com. Each app has a simple YAML configuration file where these rules can be defined.
Now we’re on the right track. We know what happened, when it happened, how bad it was, which team to notify, and where to look to fix it. If we’re able to fix the problem, we can create a Pull Request or Issue and drop the link to Haystack in the body or a future comment, and a cross-reference will automatically get created in Haystack. This allows engineers to jump back and forth between the issue and needle in addition to signaling to others who might look at the needle, that progress is happening. Finally, if this rollup crops up again in the future, there will likely be an existing discussion about the cause and how to address it.
Why didn’t you use an existing open source project and when will you open source Haystack?
Haystack has existed in some form or another since ~2009. I don’t recall what the ecosystem was like then, but it wasn’t what it is today. When we started working on updating Haystack in early 2012, we were focused on improving on our existing application. Over the years we’ve made a lot of changes to Haystack, many changes tied to other internal applications and the way we work, to get what you see today. The value of Haystack comes from the deep integration into our systems so it would be difficult to open-source, but we hope you can apply similar patterns to your infrastructure for better monitoring, alerting, and debugging.
Written by

Related posts

GitHub availability report: June 2026
In June, we experienced six incidents that resulted in degraded performance across GitHub services.

Q1 2026 Innovation Graph update: Open source collaboration is accelerating worldwide
New Innovation Graph data shows global developer communities growing faster than ever, with collaboration reaching new highs across many economies.
GitHub joins coalition advocating for fixes to California AI Transparency Act to protect open source
We’re calling for targeted amendments to resolve conflicts with open source licensing and align with international transparency frameworks while preserving regulatory intent.