Clone Graphs
Our traffic graphs tab shows you a lot of information about who’s visiting your repository on the web. We’ve added a new graph to this tab, showing git clone activity.…
Our traffic graphs tab shows you a lot of information about who’s visiting your repository on the web. We’ve added a new graph to this tab, showing git clone activity.
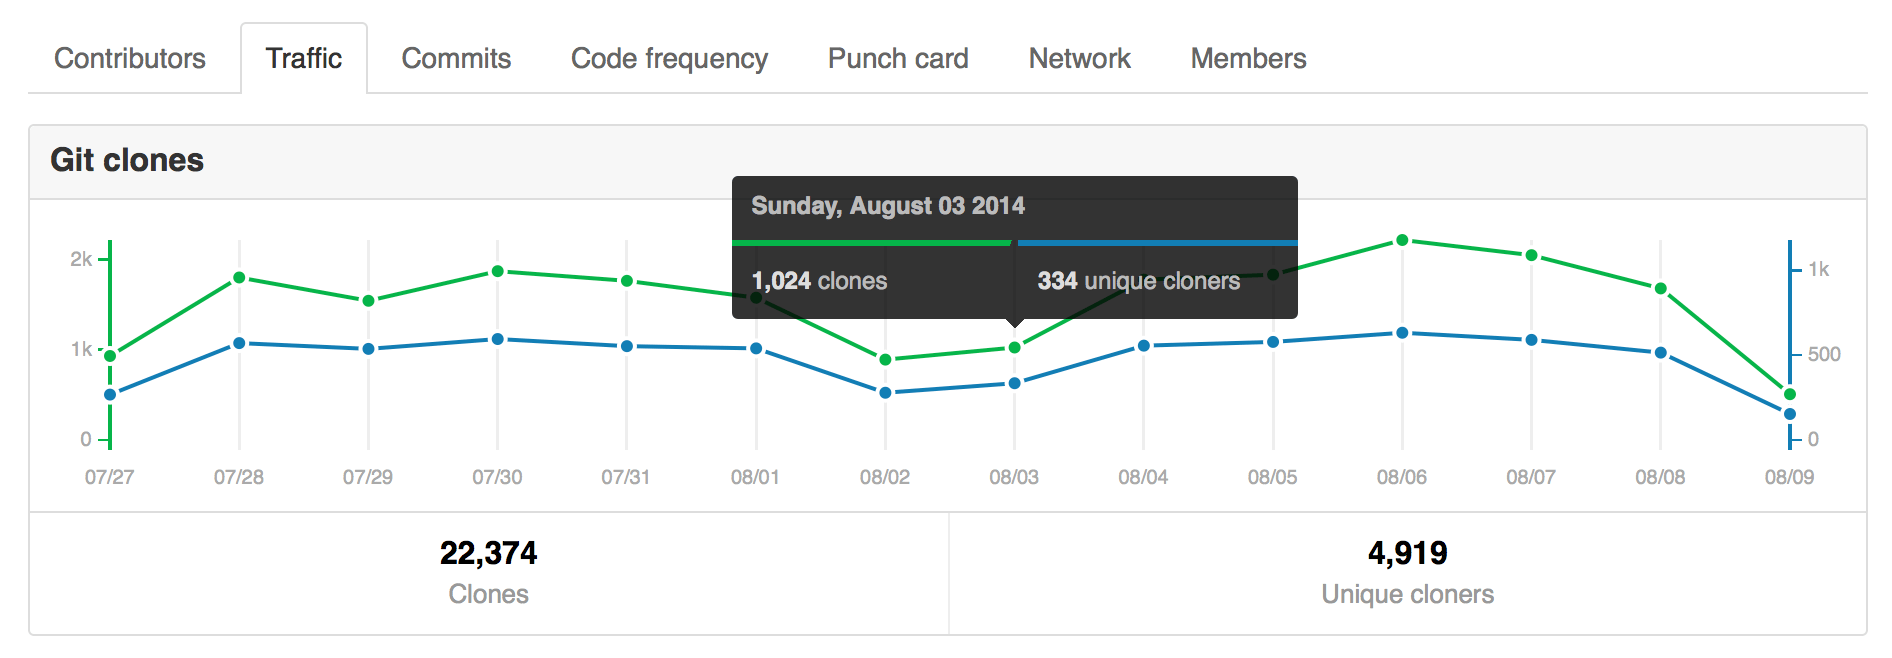
You can use it to find out how many times your repository’s source code is actually cloned in a given day, as well as how many unique GitHub users (or anonymous IP addresses) did the cloning.
For more information on traffic graphs, check out the documentation.
Written by

Related posts

GitHub Universe is back: All together now, in the agentic era
GitHub Universe is back: returning to the historic Fort Mason Center in San Francisco on October 28–29, 2026.

GitHub Copilot app: The agent-native desktop experience
At Microsoft Build 2026, GitHub introduced new tools, updates, and surfaces so agents can work the way you already work.

Still a developer. Just outside. Our latest GitHub Shop collection is here.
The ESC collection lets you escape the confines of your desk and get out into the sun where good ideas are bound to happen.