GitHub Data Challenge Winners
Last month we kicked off the GitHub Data Challenge to see what awesome things might be lurking in the GitHub public timeline. The entries were incredible! People from all over…
Last month we kicked off the GitHub Data Challenge to see what awesome things might be lurking in the GitHub public timeline.
The entries were incredible! People from all over the world contributed queries, code and beautiful visualizations that gave a unique perspective on the millions of activities that happen every week on GitHub.com.
We all voted for our favorites to select the winners and ended up with a tie for third place.
First Place: The Octoboard
The Octoboard is a stats dashboard of GitHub activity from Denis Roussel (KuiKui).

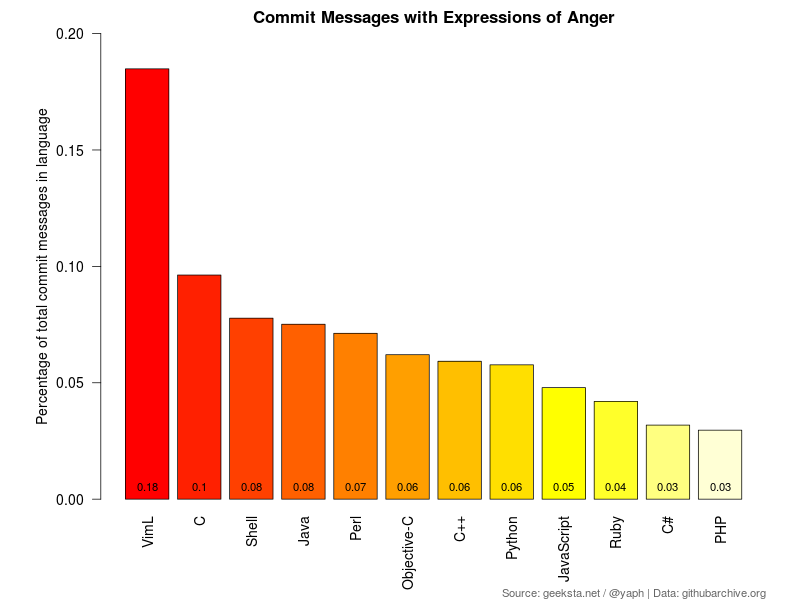
Second Place: Emotional Analysis of Commit Messages
Ramiro Gómez (yaph) analyzed Expressions of Emotions in GitHub Commit Messages.
Example: Percentage of Commit Messages with Expressions of Anger
Third Place: Le GitHub – A Daily GitHub Newspaper
Alexandre Girard (alx) used an Arduino, a thermal printer and his Le-Github gem to print a daily newspaper of GitHub activity everyday before breakfast.

Third Place (tie!): Repository Activity by Language
Eduarda Mendes Rodrigues built a visualization of GitHub activity by language using NodeXL and blogged about her process.

Thanks
I want to thank everyone who worked on an entry for the data challenge. It was really exciting for all of us to see so many different approaches on analyzing such a rich source of data. Thank you!
Our winners will receive gift certificates to the GitHub shop, $200 for 1st, $100 for 2nd and $50 for both 3rd place winners.
Written by

Related posts

GitHub availability report: June 2026
In June, we experienced six incidents that resulted in degraded performance across GitHub services.

Q1 2026 Innovation Graph update: Open source collaboration is accelerating worldwide
New Innovation Graph data shows global developer communities growing faster than ever, with collaboration reaching new highs across many economies.
GitHub joins coalition advocating for fixes to California AI Transparency Act to protect open source
We’re calling for targeted amendments to resolve conflicts with open source licensing and align with international transparency frameworks while preserving regulatory intent.