Nodeload Metrics
Nodeload 2 has been rocking since August, so I thought I’d give a quick report of its performance. Nodeload is the system responsible for dynamically building and delivering your Git…
Nodeload 2 has been rocking since August,
so I thought I’d give a quick report of its performance. Nodeload is the
system responsible for dynamically building and delivering your Git repositories as
zip files.
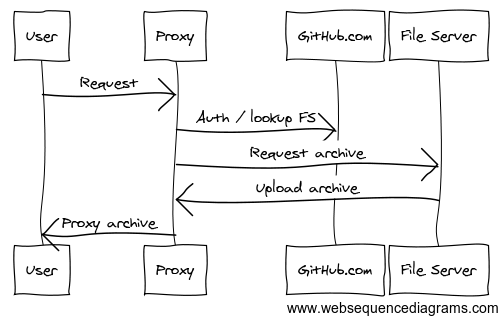
Nodeload is composed of two Node.js apps. A proxy app routes download requests to one of the 32 file servers (including failovers), and proxies the zip files back to the user. The file
servers also run an archiver app that delivers git-archive contents over HTTP.
We started instrumenting various details about the running applications months
ago to help troubleshoot problems. We can see how much zipped Git data is
written, how much data is sent, memory usage, and active connection count.
When Nodeload has problems, we can use these graphs to help pinpoint the cause.
This morning, I noticed that Nodeload hit a new record: over 1GB of Git data
sent to users in a one minute duration.
Here’s one of the cool Boundary graphs from about 15 minutes after the above
time period. It’s the throughput on the Nodeload proxy server per second, averaged
over the last 10 minutes.
This amounts to about 70GB data sent every day. I wish we had the
amazing StatsD and Graphite setup
several years ago that we have now, for comparisons.
Overall, we’ve been very happy with the Nodeload apps. Node.js makes it really
easy to prototype streaming servers through its simple and consistent streaming
APIs. Part of me would like to experiment with servers in other
languages and frameworks, but the more pragmatic side loves that we can focus on
other real problems for now.
Written by

Related posts

From pair to peer programmer: Our vision for agentic workflows in GitHub Copilot
AI agents in GitHub Copilot don’t just assist developers but actively solve problems through multi-step reasoning and execution. Here’s what that means.
GitHub Availability Report: May 2025
In May, we experienced three incidents that resulted in degraded performance across GitHub services.

GitHub Universe 2025: Here’s what’s in store at this year’s developer wonderland
Sharpen your skills, test out new tools, and connect with people who build like you.