Gauges Daily Summaries and Browser Support
We are excited to announce two new features for Gauges today. Daily Summaries Have you ever wanted a quick snapshot of how your site did the previous day, something to…
We are excited to announce two new features for Gauges today.
Daily Summaries
Have you ever wanted a quick snapshot of how your site did the previous day, something to look at during the boring morning commute? Gauges makes that possible with daily summaries for your sites via email. We made them simple and sexy, just the way you like it.
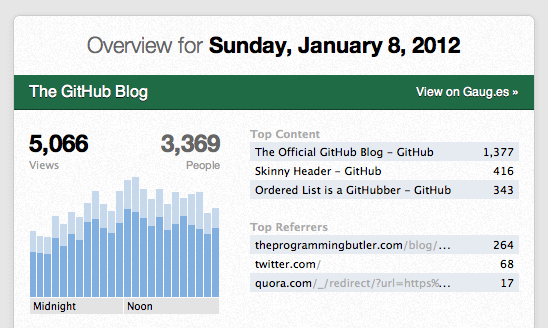
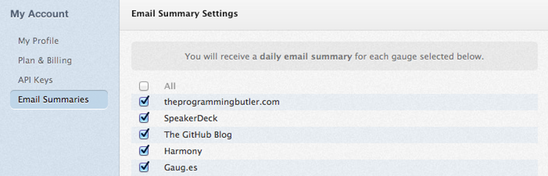
Go to My Account and then Email Summaries to turn on the daily summary for one or more gauges.
Browser Support
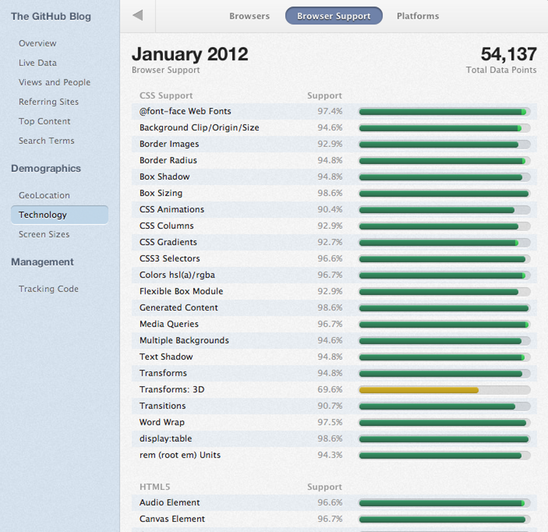
Need to find out what percentage of your users can view CSS animations or use the Javascript File API? Gauges has exactly what you need to find out the percentage of CSS, HTML5, and Javascript features your visitor’s browsers support.
View any gauge and select Technology and then Browser Support to see a graph like the one below.
Written by

Related posts

From pair to peer programmer: Our vision for agentic workflows in GitHub Copilot
AI agents in GitHub Copilot don’t just assist developers but actively solve problems through multi-step reasoning and execution. Here’s what that means.
GitHub Availability Report: May 2025
In May, we experienced three incidents that resulted in degraded performance across GitHub services.

GitHub Universe 2025: Here’s what’s in store at this year’s developer wonderland
Sharpen your skills, test out new tools, and connect with people who build like you.